
What does each widget in the trading terminal show?
Every part of the trading terminal is a widget you can open, move, resize, or close. This article walks through what each one shows and when you’d reach for it. Every widget is available during your free trial; after that, a couple need a specific plan or add-on, flagged below. See altrady.com/pricing for what each plan includes.
Chart
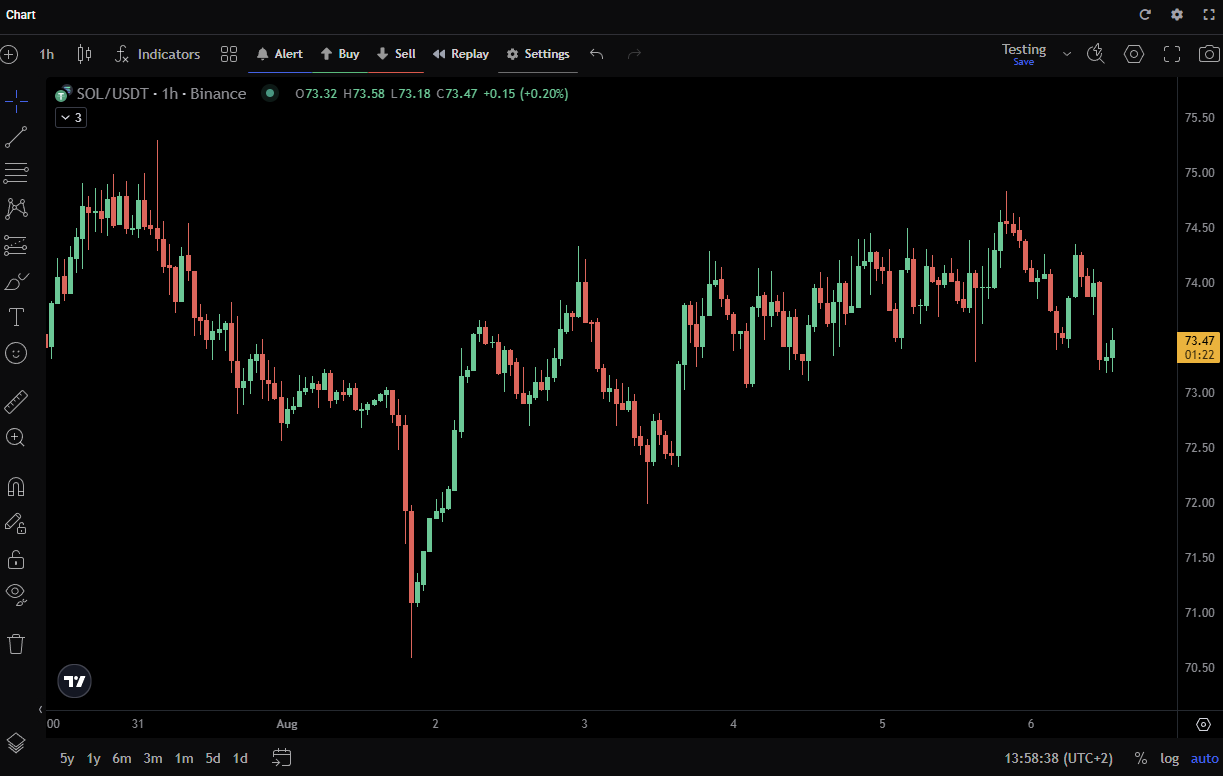
The main price chart (labeled Chart in the widget picker). This is where you read price action, add indicators, and draw support/resistance or trendlines. Most layouts keep it as the largest widget since everything else supports what you see here.
 🔍 Click the image to see a larger version
## Trading
🔍 Click the image to see a larger version
## Trading
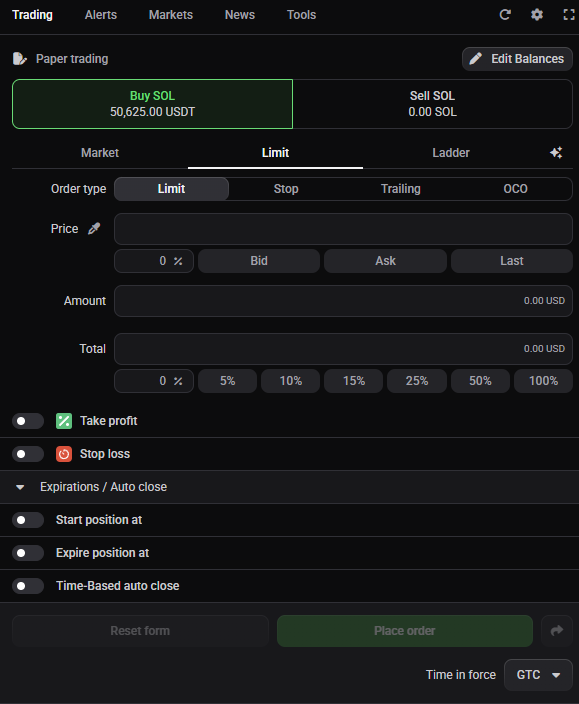
Labeled Trading in the widget list, this is your order entry widget: pick market or limit orders, set quantity, and place orders on the active market. Open it whenever you’re ready to enter or size a position.
 🔍 Click the image to see a larger version
## Tools
🔍 Click the image to see a larger version
## Tools
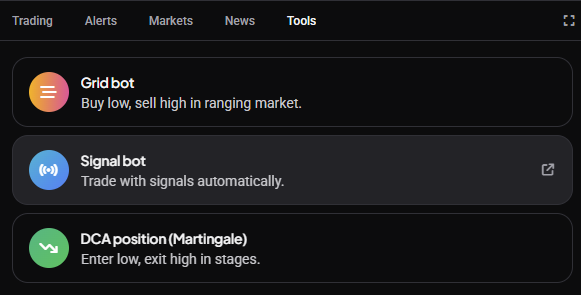
Tools is where automated setups start. It offers three options, each with a short description next to it:
- Grid bot, “Buy low, sell high in ranging market”: places a ladder of buy and sell orders inside a price range you set. You can also create one from the Bots page, which carries more setup options. See How to Set Up a Grid Bot.
- Signal bot: choosing this takes you to the Signal Bot setup on the Bots page rather than opening a form here, so it’s a shortcut rather than a separate flow. See How to Set Up a DCA / Signal Bot.
- DCA position (Martingale), “Enter low, exit high in stages”: opens a position immediately and lines up further entries below it, so your average entry price comes down if price falls. This one is a position rather than a bot, and it’s configured and started here in the Tools widget. See How do I create a DCA position?.
The difference worth knowing: a signal bot waits for a signal before it does anything, while a DCA position starts as soon as you confirm it.
 🔍 Click the image to see a larger version
## My Positions and My Orders
🔍 Click the image to see a larger version
## My Positions and My Orders
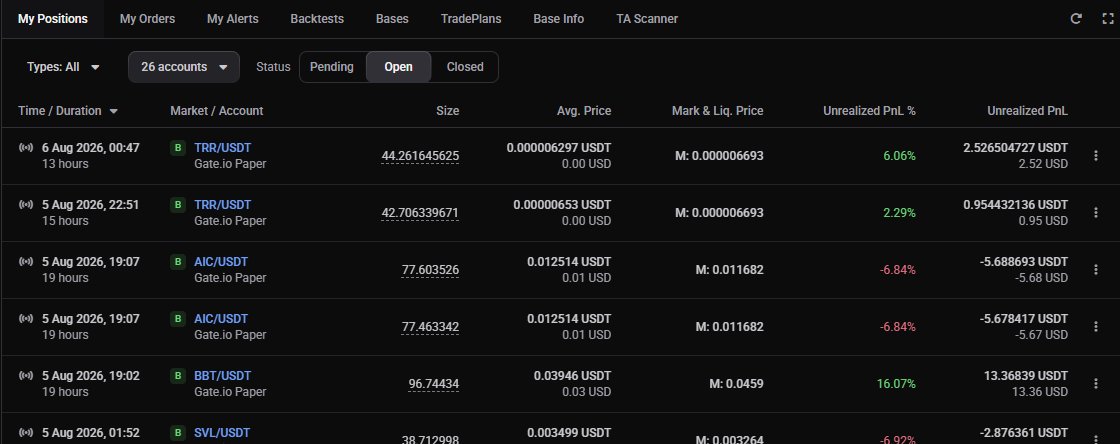
My Positions lists everything currently open on the active exchange account: entry, size, and running P/L. My Orders lists orders that haven’t filled yet (limit orders, pending take-profits, stop-losses). Keep both open side by side so you always know what’s live versus what’s still waiting.
 🔍 Click the image to see a larger version
## Base Info and Bases
🔍 Click the image to see a larger version
## Base Info and Bases
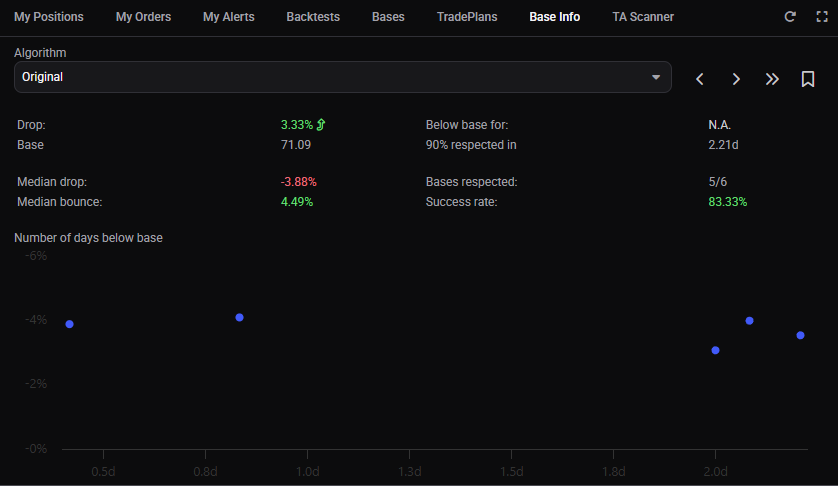
Base Info shows statistics for the market (base) you’re viewing: things like recent price behavior and the drop percentages used by Altrady’s scanning presets. Bases lists the coins and markets Altrady is tracking against those scanner presets. Both are available on the Essential and Premium plans.
 🔍 Click the image to see a larger version
## Position Info
🔍 Click the image to see a larger version
## Position Info
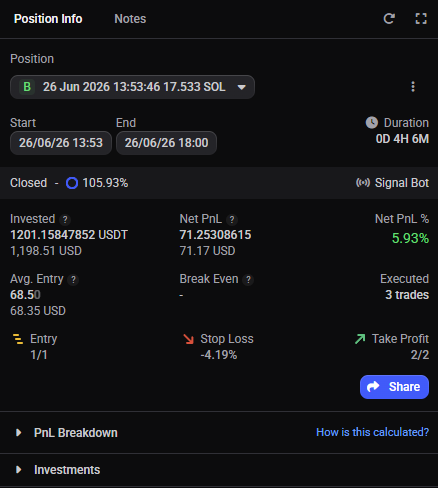
Position Info is the profit/loss breakdown for positions on the currently selected market and trading account. It shows:
- Invested amount, Average Entry Price, and Break Even price (the price at which PnL would be zero after fees).
- Net PnL (realized profit/loss minus fees) and Unrealized PnL (floating profit/loss on what’s still open).
- Fees Paid across all filled orders in the position, and the number of Executed trades.
The widget also has controls. For Smart positions you can Edit (which loads the position into the Trading widget) or Close Position via market or limit order. For date-based (Spot/Futures) positions you can Mark as Closed to set the end date automatically.
Position Info works across all position types: Smart, Signal Bot, Spot, Futures, and Grid Bot. Grid Bot positions can be viewed here but are managed from the Bots page.
You can also create date-based positions from this widget. Select + Create Position, then set a start date either through the calendar in the widget or by right-clicking a candle on the chart and choosing Set Break Even Start. Setting an end date (via calendar or Set Break Even End on the chart) closes the position. Save the position with the floppy-disk icon; until you save, it stays as a draft and won’t appear in My Positions.
 🔍 Click the image to see a larger version
## Alerts and My Alerts
🔍 Click the image to see a larger version
## Alerts and My Alerts
Alerts is where you create a new price or indicator alert on the market you’re viewing. My Alerts lists every alert you’ve set, so you can review, edit or delete them without leaving the terminal.
TA Scanner
TA Scanner runs Altrady’s technical-analysis scans across markets and lists the matches; treat its output as statistical analysis of historical data, not a signal to act on automatically. You still decide what, if anything, to do with a match.
Order Book, Market Depth, and Trades
Order Book shows live buy and sell orders stacked by price for the current market. Market Depth visualizes that same order book as a depth chart, handy for spotting where liquidity clusters. Trades streams the most recent executed trades on the market in real time. Together they give you a feel for short-term supply and demand before placing an order.
Markets
Markets is a searchable list of every market available on your connected exchanges. Click any market to open it in the current tab.
The Markets widget is shown when you click + to the right of your open tabs, or can be enabled in the widget list and parked in a widget group.
The widget has three tabs: Markets (all markets), Recent (your most recently viewed markets), and Open Orders (markets where you currently have an open order). All columns (price, 24h change, 24h volume in BTC) can be sorted by clicking the column header.
You can narrow the list with exchange filters and watchlist filters along the top. Hold CTRL (Windows) or CMD (Mac) to select more than one exchange or watchlist at a time. The search bar supports pattern matching: for example, btc/ finds all BTC pairs, /btc finds pairs quoted in BTC, and ^btc/ restricts to pairs starting with BTC. A Filter button lets you set ranges for price, volume, or 24h change; a small blue dot appears next to it when a filter is active.
Watchlists let you bookmark markets you want to track. Create one with +Add at the bottom of the watchlist filters or by right-clicking a market name. Each watchlist gets a name, short name, and optional color. Right-click a watchlist for controls like Edit Watchlist, Make Default, Remove all Markets, or Delete Watchlist. Right-click the Markets widget name to open Settings, where you can choose which exchanges and watchlists appear and reorder them.
Notes, News, and Backtests
Notes is a simple space to jot down your own reasoning on a market or position, for your own reference later. News pulls in market-related headlines. Backtests shows the results of a saved replay backtest against historical candles: entries, exits, and outcome, framed as historical data that does not predict future performance. Backtesting is a separate paid add-on.
Arranging what you actually use
You don’t need every widget open at once. A typical layout might pair the Chart with Trading and My Positions, then add Order Book or TA Scanner only when you’re actively hunting for an entry.
You add, move, group, and save widgets from the layout itself, all by drag-and-drop, and the Simple and Advanced layouts give you two ready-made starting points. For the full walkthrough, see Simple and Advanced layouts: customising your trading screen.
Still stuck?
If a widget you expect to see isn’t in your widget picker, or a widget isn’t showing the data you expect, reach out through support chat in the app and the team can take a look at your account setup.