
An introduction to SuperChart
SuperChart is the chart you get in Altrady by default. It replaces the TradingView chart that earlier versions opened with, and it draws your orders, positions, alerts and bases directly on the price. This article is a quick tour of where things are, so you can find your way around in a few minutes.
Open the chart settings
 🔍 Click the image to see a larger version
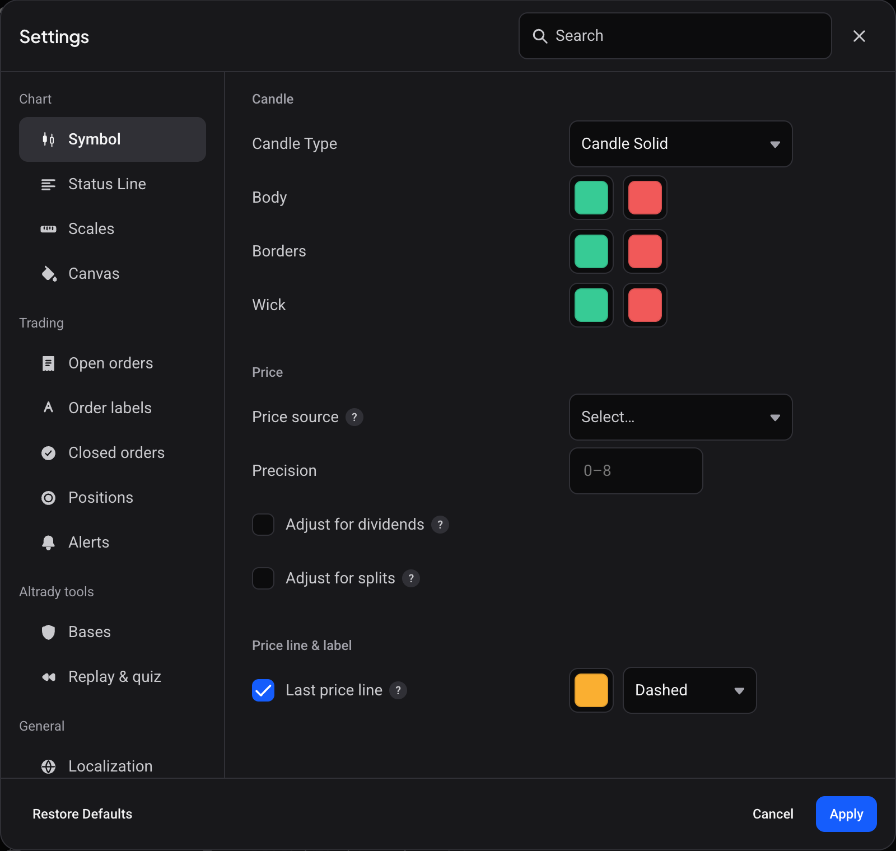
Almost everything about how the chart looks and what it draws sits in one place: the chart settings. Click the gear Settings button on the chart header, or press Cmd+, on a Mac or Ctrl+, on Windows.
The settings are grouped in the sidebar of the window:
- Chart: Symbol, Status Line, Scales and Canvas, for colours, candle style and the price scale.
- Trading: Open orders, Order labels, Closed orders, Positions and Alerts, for what the chart draws from your account.
- Altrady tools: Bases and Replay & quiz.
- General: Localization, Preferences, Themes.
Changes preview on the chart while the window is open. If you press Cancel, the chart goes back to how it was.
Switch between SuperChart and TradingView
 🔍 Click the image to see a larger version
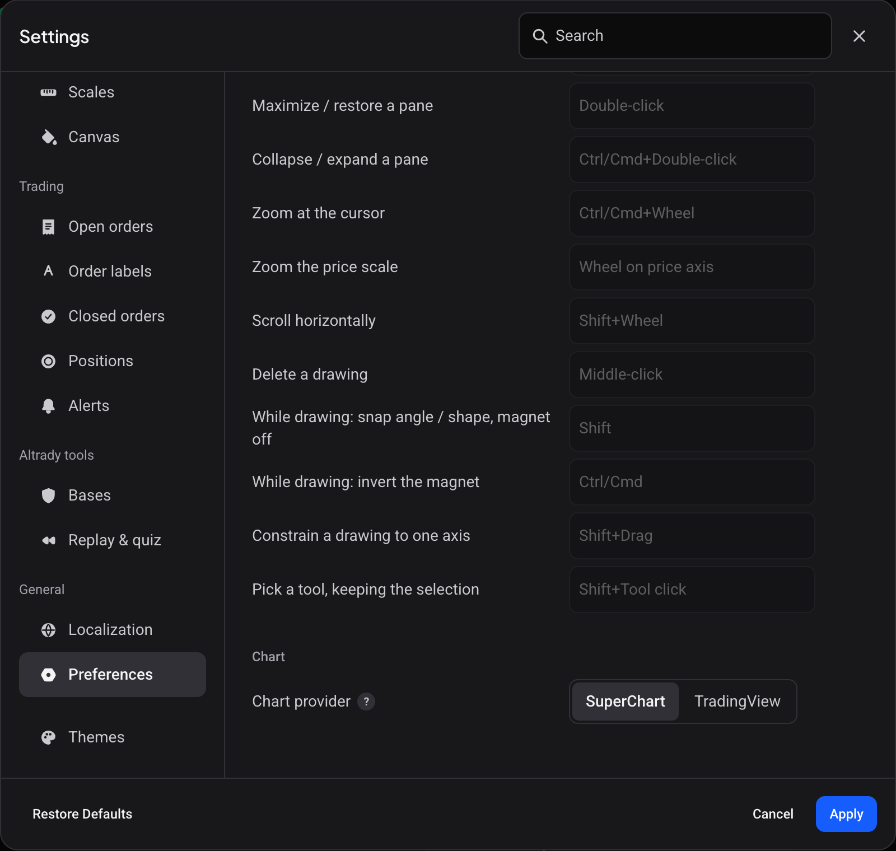
SuperChart is the default, but the TradingView chart is still there if you prefer it. Open the chart settings, go to Preferences and look for Chart provider. Pick SuperChart or TradingView. Switching reloads the chart, and it ends a replay session if one is running, so Altrady asks you to confirm first.
Some settings are named differently on the two charts. This help center describes SuperChart unless it says otherwise.
Bring your TradingView charts across
 🔍 Click the image to see a larger version
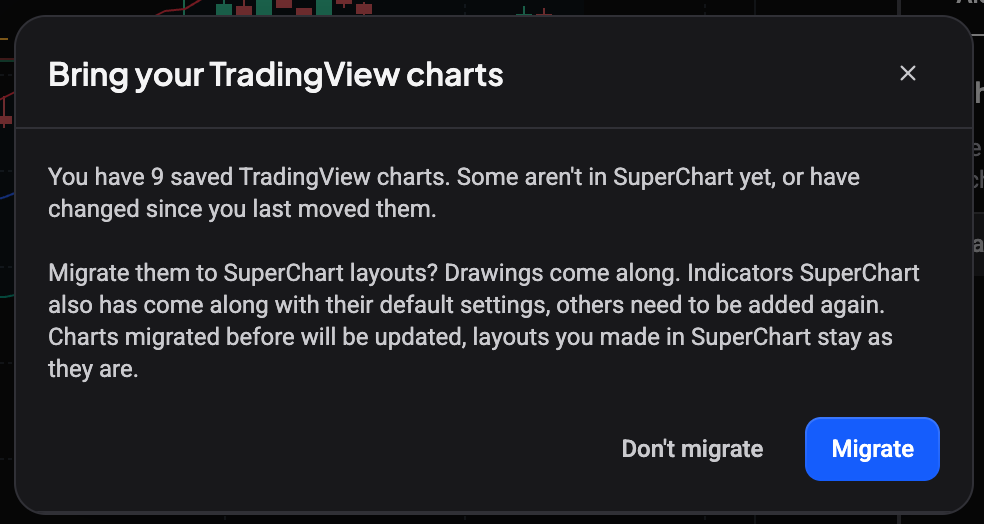
If you have saved charts from the TradingView chart, Altrady offers to move them over the first time SuperChart opens. The window is called Bring your TradingView charts. Choose Migrate to convert them into SuperChart layouts, or Don’t migrate to leave them where they are.
What comes along:
- Your drawings move over, except tools SuperChart does not have yet. The summary at the end tells you which ones were skipped.
- Indicators that SuperChart also has move over with their default settings. Others need to be added again.
- Layouts you made in SuperChart yourself stay as they are.
The summary lists how many layouts, drawings and indicators were moved, so you can see what to check.
Chart several markets in one tab
 🔍 Click the image to see a larger version
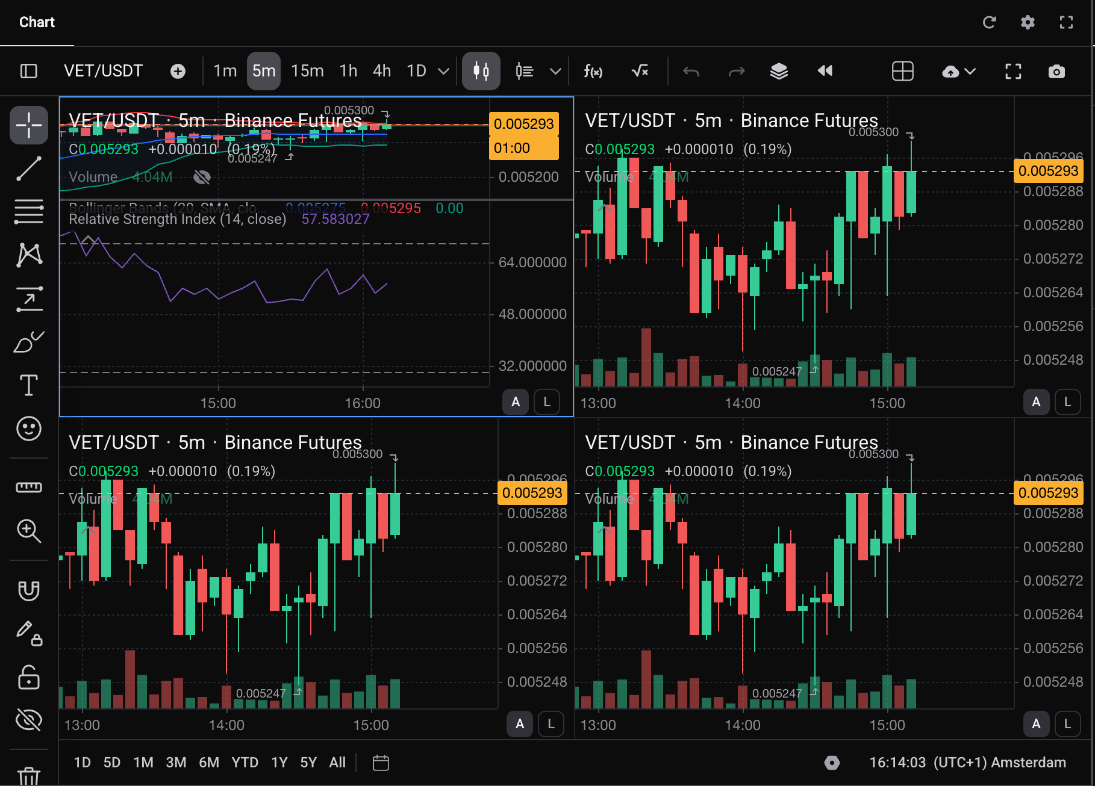
A SuperChart tab can hold more than one chart in a grid, each with its own market and timeframe. You can save a grid arrangement as a preset: give it a name (the name field suggests something like “BB scalping”) and bring it back on another tab later.
Compare markets with a custom formula
 🔍 Click the image to see a larger version
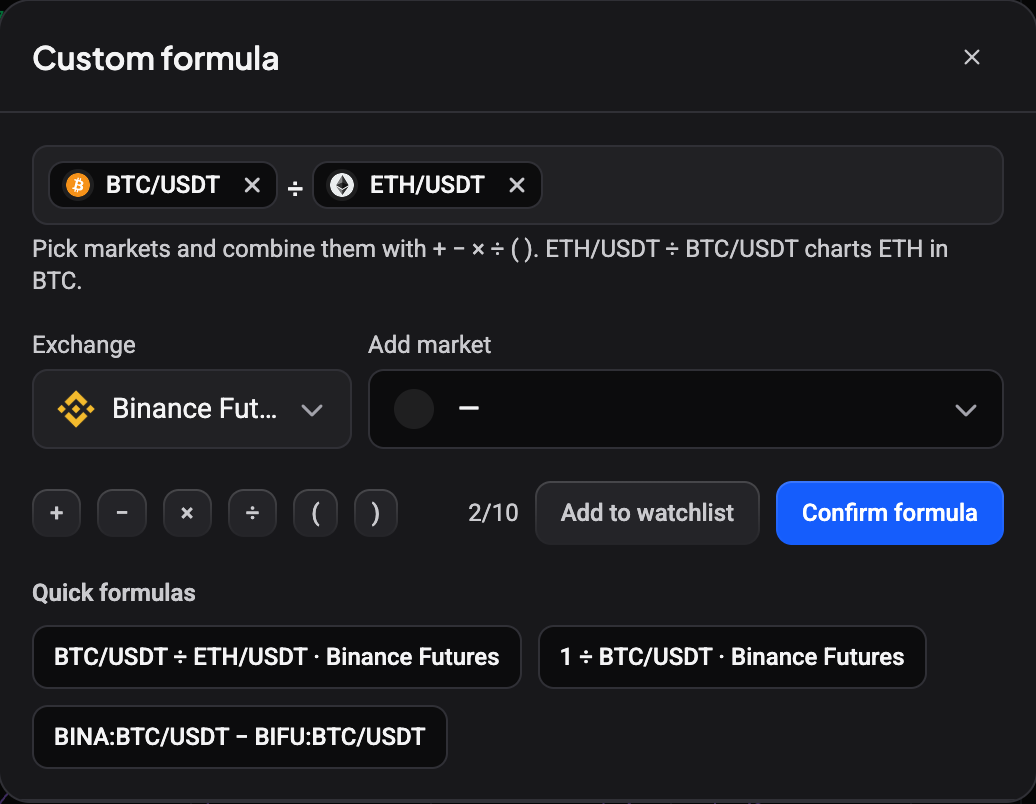
A formula chart plots a calculation between markets instead of a single price. Open the Custom formula window from the chart header, pick markets, and combine them with + − × ÷ and brackets. For example, ETH/USDT ÷ BTC/USDT charts ETH priced in BTC.
The window offers Quick formulas for the common cases (a coin priced in another coin, the inverse of a market, and the gap between a spot and a perpetual price), and keeps your Recent formulas so you can reuse them. Choose Confirm formula to draw it. If the formula has a mistake or uses a market that is no longer available, the window tells you.
Edit orders and positions from the chart
SuperChart draws your open orders, closed orders, positions and alerts as lines and handles on the price. What you can do with them depends on the switches in the Trading group of the chart settings:
- Edit orders by dragging moves an open order when you drag its line to a new price.
- Cancel orders with ✕ cancels an open order from the chart.
- Close positions with ✕ closes a position from the chart.
- PnL handle shows your PnL and position size at the average entry.
What each order line shows is up to you: see Order labels on the chart. Other chart basics: change the timeframe, add indicators, use the drawing tools and see volume at every price with the volume footprint.
Still stuck?
If the chart does not look the way this article describes, check the Chart provider setting first: the TradingView chart has different menus. If it still looks wrong, reach out through support chat inside Altrady and the team will take a look with you.