
How do I use the chart drawing tools?
You can draw directly on any Altrady chart: trend lines, support and resistance levels, Fibonacci retracements, shapes, and text notes. Everything you draw stays on the chart until you remove it, and you can lock a drawing so it doesn’t shift by accident.
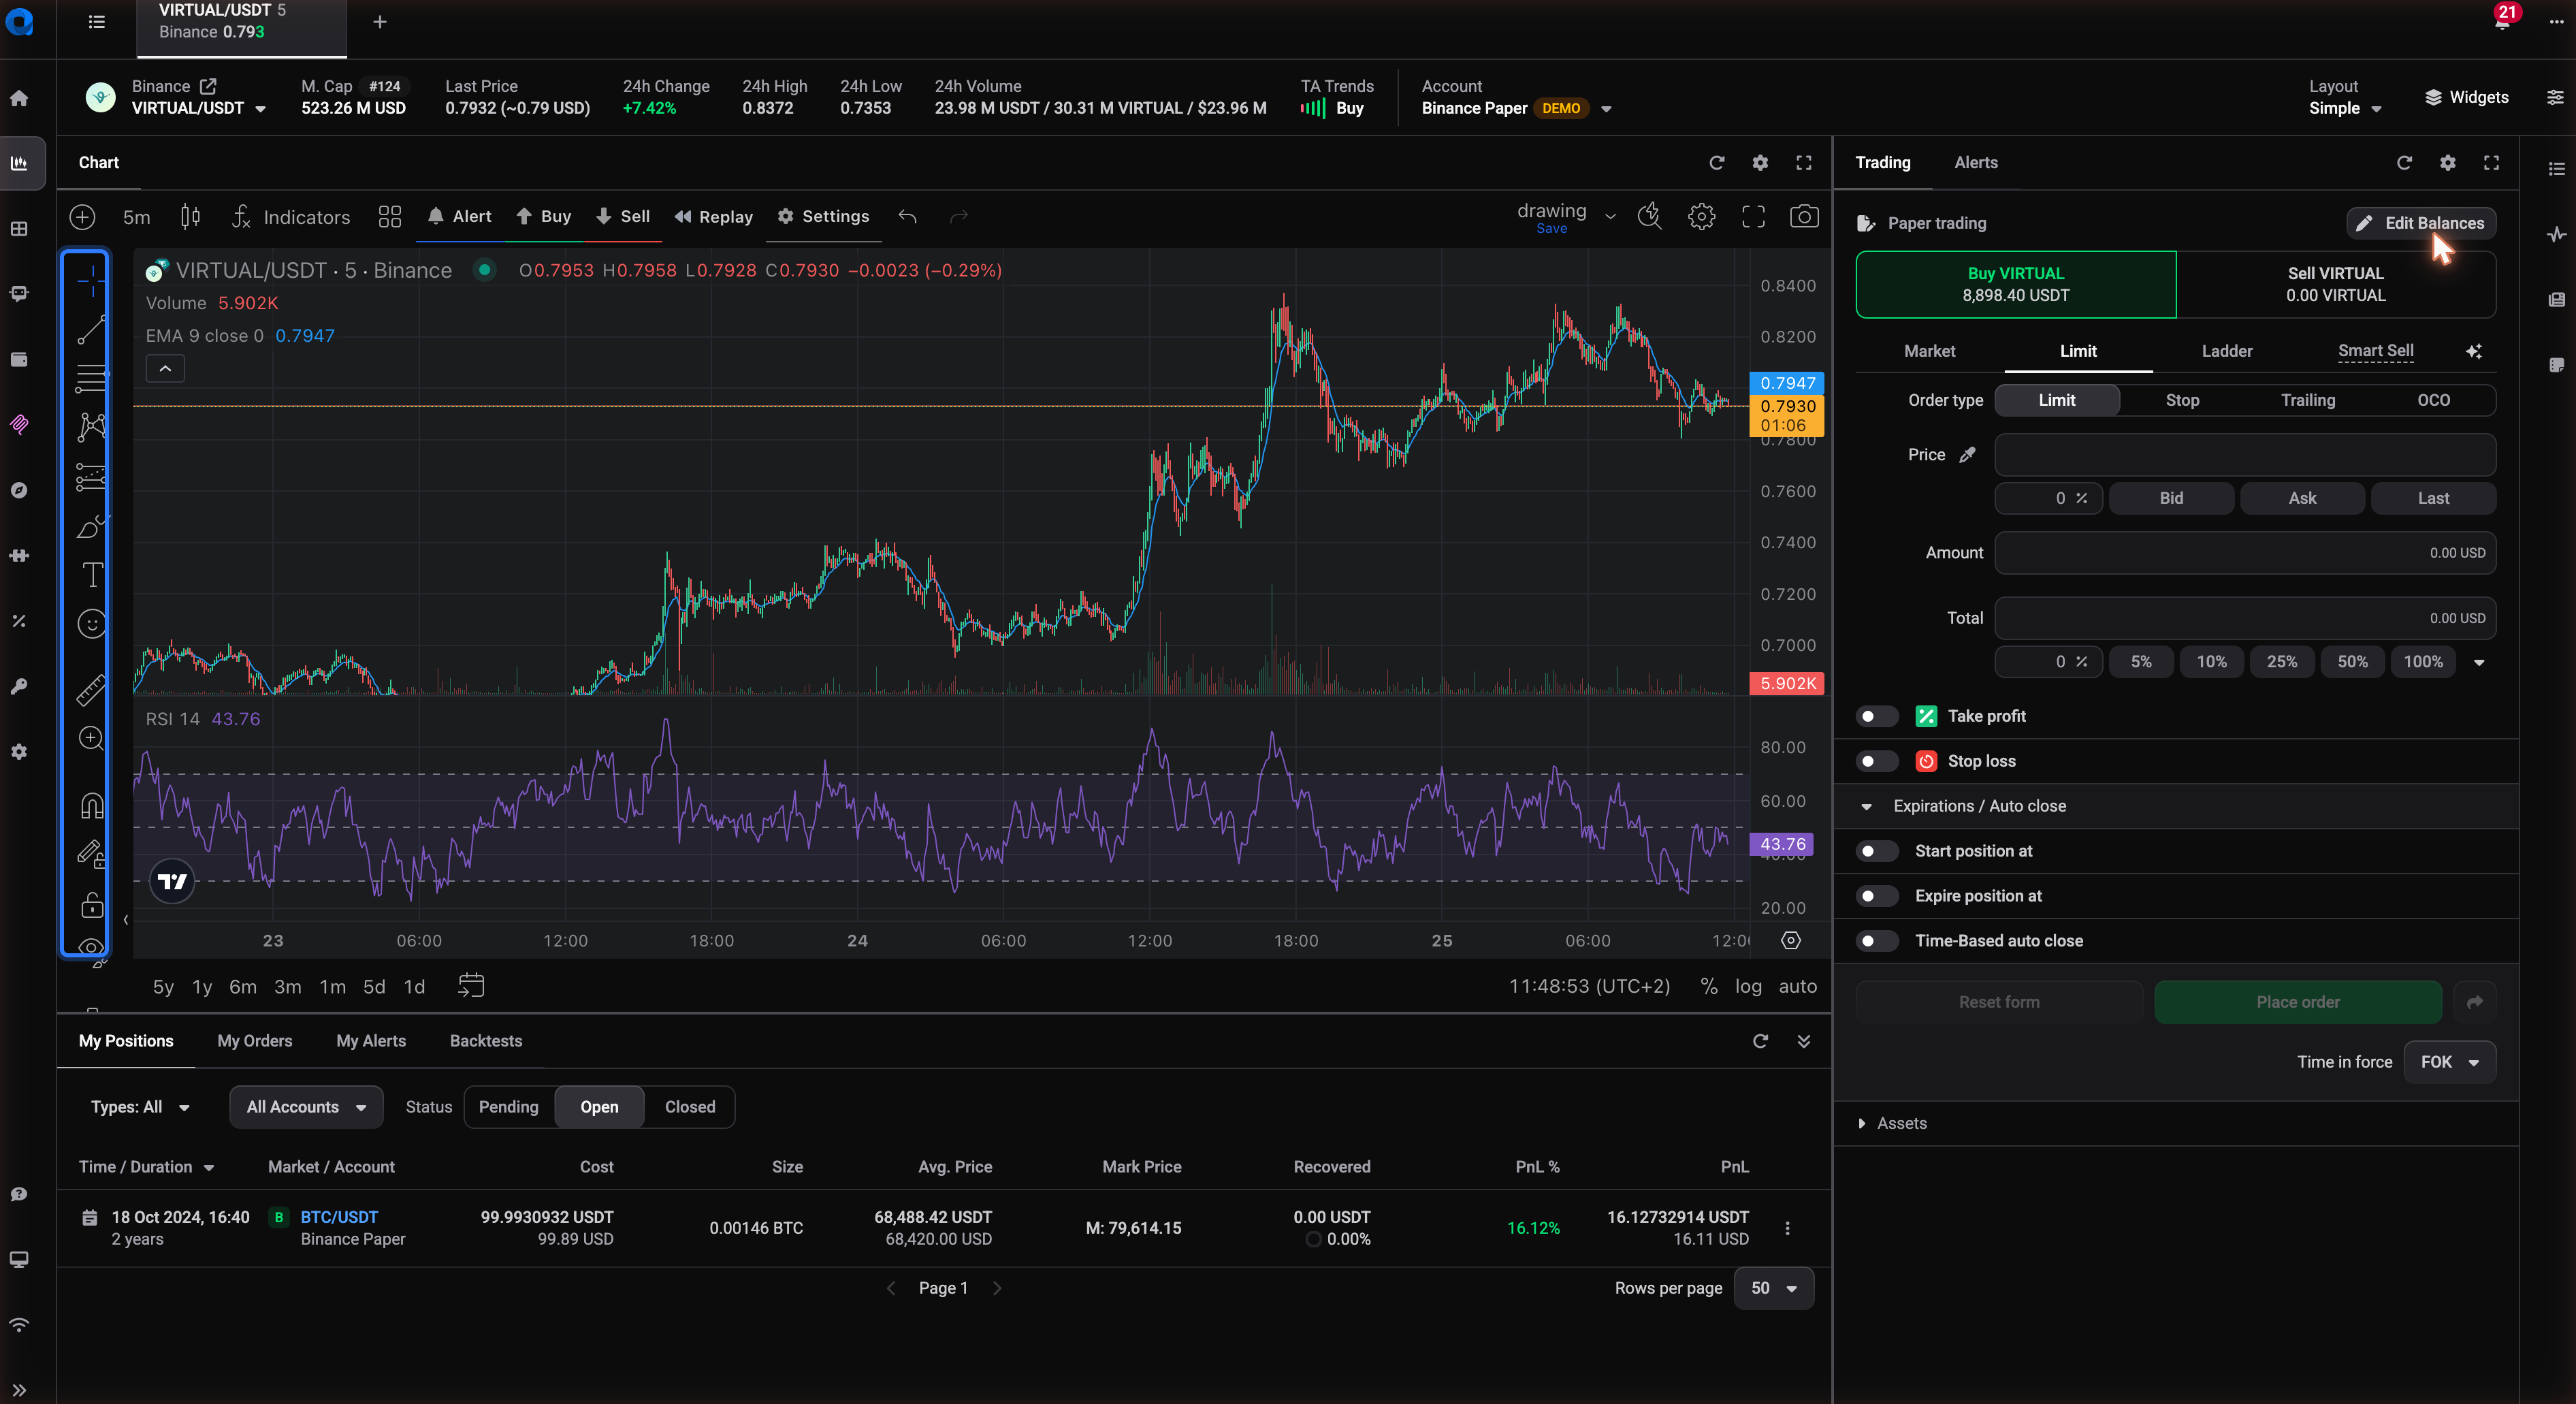
Open the drawing toolbar
 🔍 Click the image to see a larger version
The drawing toolbar sits along the left edge of the chart in the trading terminal. Click any tool to activate it, then click (and for multi-point tools, click again) on the chart to place it. Click the tool’s icon again, or press Escape, to stop drawing.
The toolbar groups tools by type:
- Line tools: trend lines, horizontal and vertical lines, rays, and parallel channels. Use these for trend lines and for marking support and resistance levels.
- Fibonacci tools: Fibonacci retracement, extension, and fan tools. Click your first point (usually a swing low or high), then click your second point to draw the levels between them.
- Shapes and text: rectangles, ellipses, arrows, and text labels for annotating a setup or leaving yourself a note.
- Multipoint tools: tools like trend angles or paths that need more than two clicks to complete. Click each point in order, then press Escape or double-click to finish the shape.
Don’t worry about picking the “right” tool on the first try: any drawing can be deleted and redrawn in a few seconds.
Select, move, and resize a drawing
Click directly on a drawing to select it. Selected drawings show small square handles at their key points (the ends of a line, the corners of a rectangle, the two anchor points of a Fibonacci tool).
- Click the drawing to select it.
- Drag the body of the drawing to move it, or drag one of the handles to resize it or change its angle.
- Click on empty chart space to deselect.
If you can’t seem to grab a drawing, zoom in a little first: on a busy chart with several overlapping lines, the click target for a thin line can be narrow.
Lock a drawing so it doesn’t move
 🔍 Click the image to see a larger version
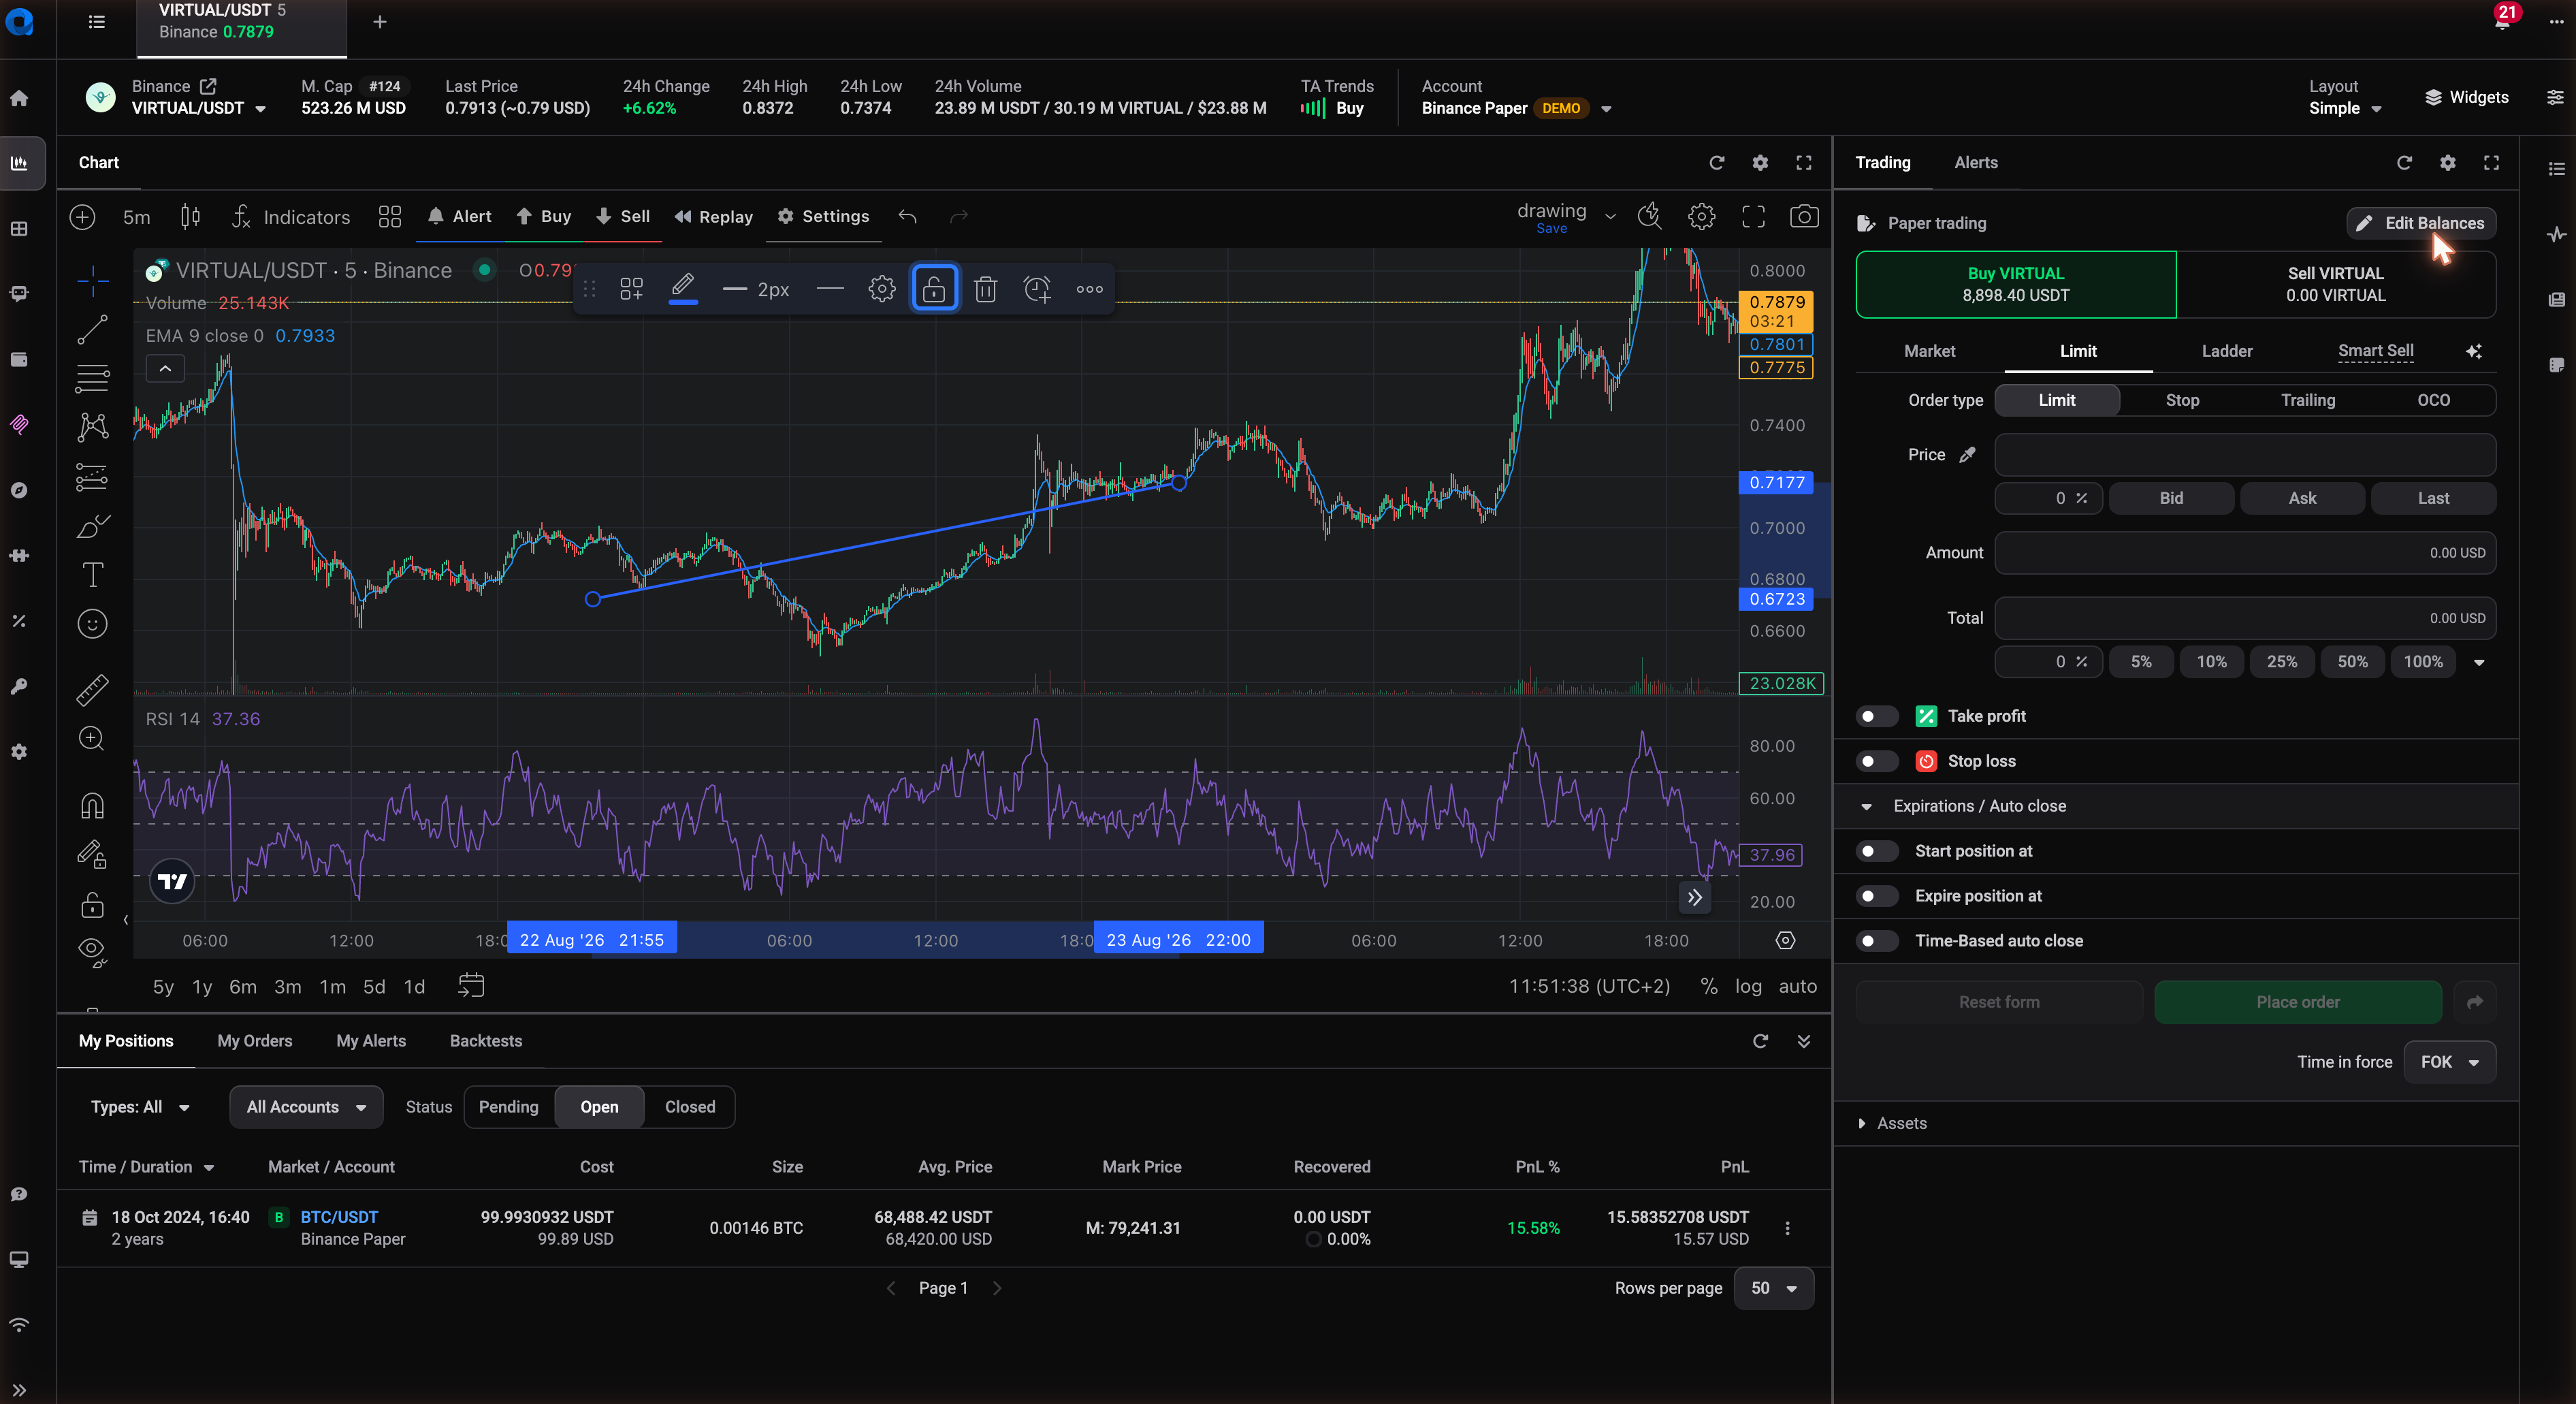
Once a trend line or level is placed where you want it, lock it so a stray click or drag can’t nudge it out of position. Click the drawing once to select it: a small toolbar appears above the chart. Click the padlock icon in that toolbar. A locked drawing can still be seen and selected, but it won’t move until you click the padlock again to unlock it.
This is worth doing for any level you’re tracking over several days: support and resistance lines you check back on, or a trend line you’re using to judge a breakout.
Change a drawing’s style
Select the drawing and click the gear icon in its toolbar (double-clicking the drawing opens the same dialog), where you can change line color, thickness, style (solid, dashed, dotted), and for Fibonacci tools, which levels are shown. Changes apply only to that one drawing unless you save them as a template.
Edit or delete a drawing
- Select the drawing.
- Press Delete (or Backspace) to remove it, or right-click and choose the remove option.
- To clear every drawing on the chart at once, use the toolbar’s “remove all drawings” option rather than deleting them one by one.
Deleting a drawing only removes it from that chart. It doesn’t affect your indicators, your open positions, or any bots running on that market.
Reuse a drawing’s style as a template
If you’ve set up a Fibonacci tool or trend line with colors and settings you like, you can save that single drawing’s style as a drawing template and apply it to new drawings later, so you’re not rebuilding the same look every time. This is a separate template type from a full chart template, which saves your entire layout including indicators and panels. For saving and loading a full chart setup, see How do I save and reuse a chart template?.
Still stuck?
If a drawing tool isn’t responding, or a drawing keeps disappearing after you switch symbols or timeframes, reach out through support chat inside Altrady and describe which tool you were using. A screenshot of the chart helps the team spot the issue faster.