
How do I change the chart timeframe?
Click the interval button on the chart’s top toolbar (it shows the chart’s current timeframe, for example “1h”) and pick another resolution from the list. It only changes how candles are grouped on that chart, it does not touch your order form or any bot settings.
Find the timeframe selector
 🔍 Click the image to see a larger version
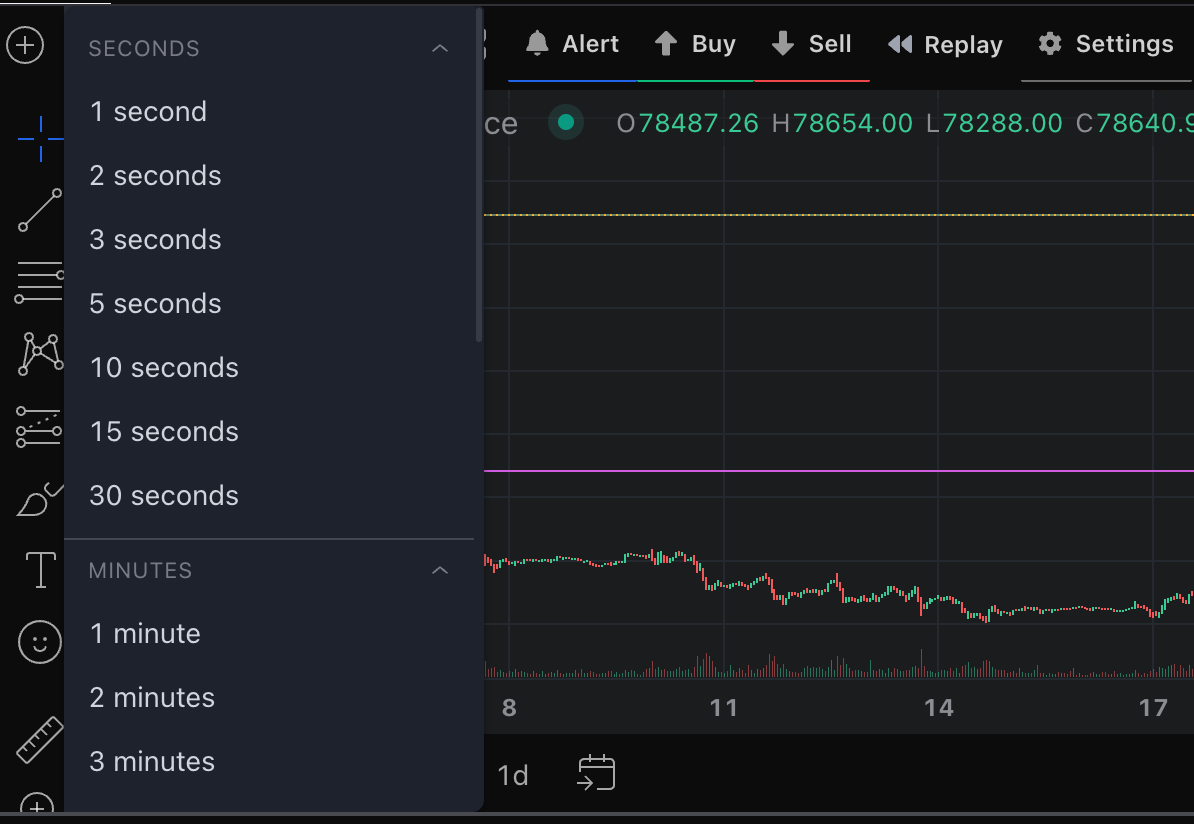
Every chart in the trading terminal has a toolbar along the top. The interval button sits on the left of that toolbar and always shows what the chart is currently drawing: “15m” for 15-minute candles, “1h” for hourly, “1d” for daily. Click it and the list of available resolutions opens, grouped into SECONDS, MINUTES, HOURS and DAYS so you can jump straight to the range you want.
If you have several charts open side by side, each one has its own toolbar and its own timeframe. Clicking the interval button on one chart never changes the others.
Pick a timeframe
- Click the interval button on the chart toolbar.
- Scroll to the group you want and click the resolution. The one you are on is highlighted.
- The chart redraws with candles grouped at the new resolution. Your indicators and drawings stay where they are, they simply reflow to the new candle spacing.
There is no save step. Altrady stores the resolution with that chart tab, so the tab opens on the same timeframe next time.
Each row also has a small star on the right. Starring a timeframe marks it as a favourite so it is quicker to reach next time.
Which resolutions are available
Altrady’s charts support these intervals:
- Seconds: 1, 2, 3, 5, 10, 15 and 30 seconds
- Minutes: 1, 2, 3, 5, 10, 15 and 30 minutes
- Hours: 1, 2, 4, 6 and 12 hours
- Days and longer: 1 day, 2 days, 1 week, 2 weeks, 1 month
Some intervals you may know from other tools are not in that list, 8-hour and 3-day candles for example.
Note that the sub-minute timeframes have no history. Their candles are built from the moment you select the resolution, so the chart starts empty and fills in as new candles form.
Add a custom interval
If the exact interval you want is not in the list, build it at the bottom of the same dropdown. There is a row with a number field, a unit dropdown (minutes, hours, days) and an Add button:
- Type the number you want in the field, for example 45.
- Pick the unit from the dropdown.
- Click Add.
The interval is added to the list and the chart switches to it.
Second-based candles have one limitation worth knowing in advance: chart replay does not run on second resolutions. If you switch a chart to 15 seconds and replay is unavailable, that is expected, not a fault on your account.
What changing the timeframe does not affect
The resolution you pick changes candle aggregation on that chart only. It does not change:
- Your order form. Order type, price and size are set independently when you place a trade.
- A grid bot. Grid bots do not use a chart timeframe at all, they place orders within a price range you configure separately. Grid bots run on spot markets only.
- A signal or DCA bot’s own candle resolution, which is part of that bot’s form and decides which candles its entry conditions are evaluated on.
So switching one chart to 4 hours to check the bigger picture is completely safe while bots and open positions are running.
Still stuck?
If the interval button is missing, greyed out, or the chart will not redraw after you pick a resolution, reach out through Altrady’s support chat from inside the app and describe what you see. A team member can take a closer look at your account.