
Volume footprint on the chart
The volume footprint is a chart type that shows how much was bought and sold at every price inside each candle, instead of only the open, high, low and close. It is part of SuperChart and takes a minute to switch on.
What the footprint shows
 🔍 Click the image to see a larger version
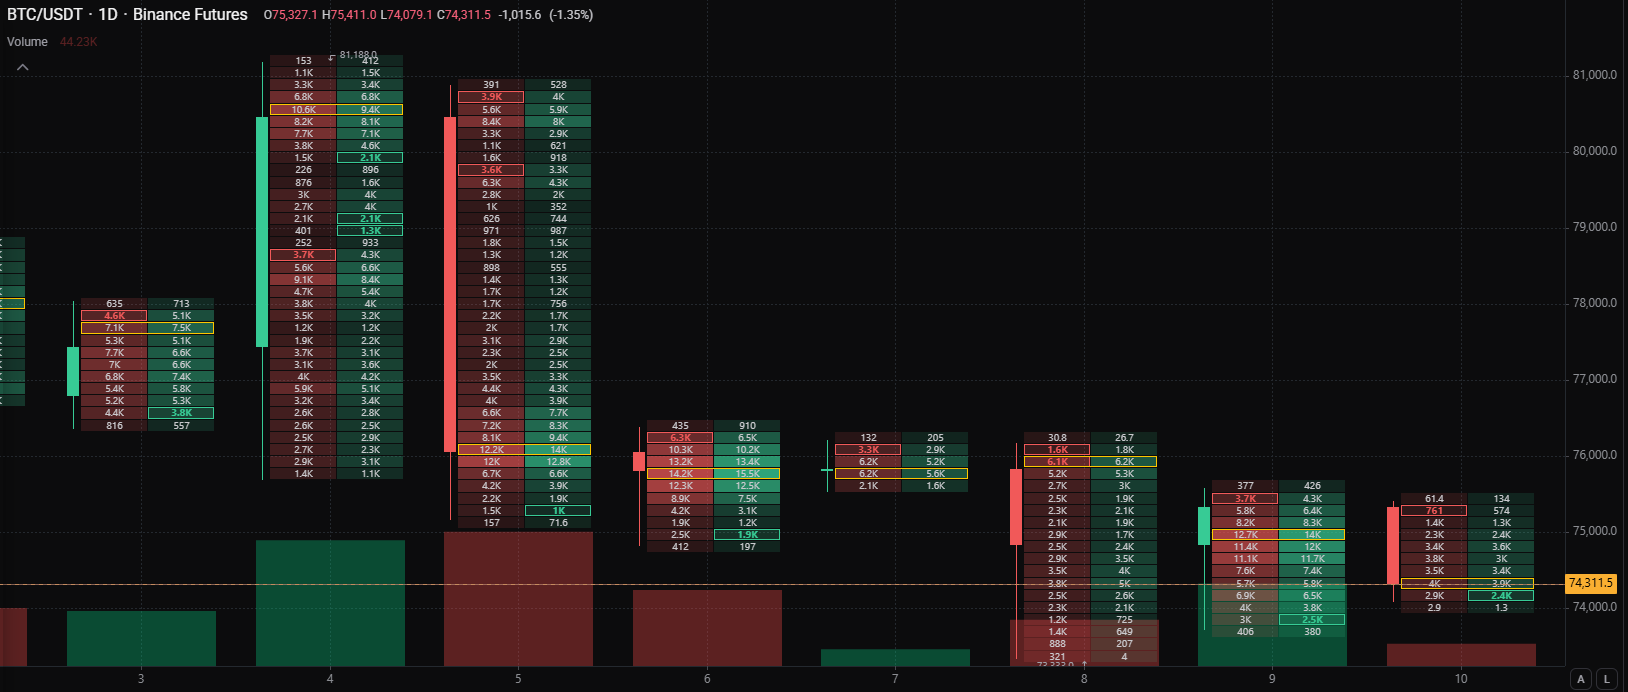
This is the Bid × Ask style, the default. In each row, sell volume (red) is on the left and buy volume (green) is on the right, and the yellow outline marks the row with the most volume.
A normal candle is one block per period. A footprint candle is split into price rows, and each row shows the buy and sell volume that traded at that price during the period. This lets you read where volume concentrated inside a candle. It describes what already traded; it does not predict what comes next.
Where it is available
The volume footprint needs trade data, so it works on selected markets only: Binance, Binance Futures, Bybit Futures and Hyperliquid Futures. It is included with the Premium plan.
On other plans you can still try it: it stays in the chart type list and runs on one market, Binance Futures BTC/USDT, as a preview. When you pick it, Altrady shows what the footprint does, and the Try it on Binance Futures BTC/USDT button opens that market with the footprint on.
Switch the footprint on
 🔍 Click the image to see a larger version
- Open a market that supports it, for example Binance Futures BTC/USDT.
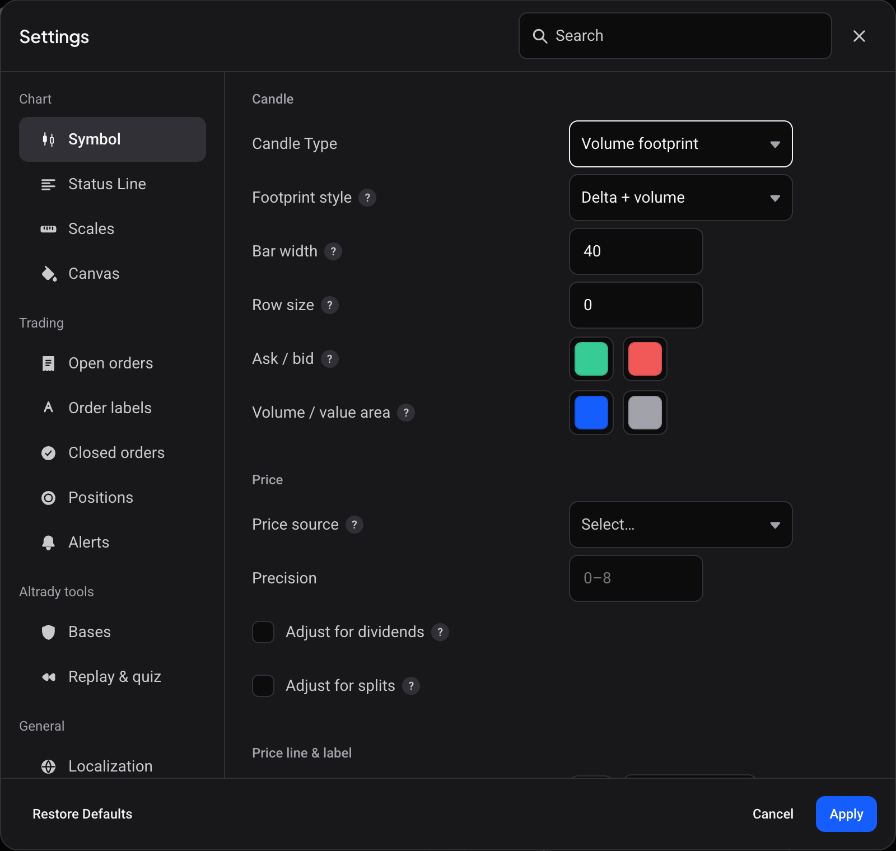
- Click the gear Settings button on the chart header, or press Cmd+, on a Mac or Ctrl+, on Windows.
- In the sidebar, under Chart, open Symbol.
- Set Candle Type to Volume footprint.
To go back, set Candle Type to Candle Solid again. On a market without footprint data the chart type stays unavailable.
Choose a footprint style
 🔍 Click the image to see a larger version
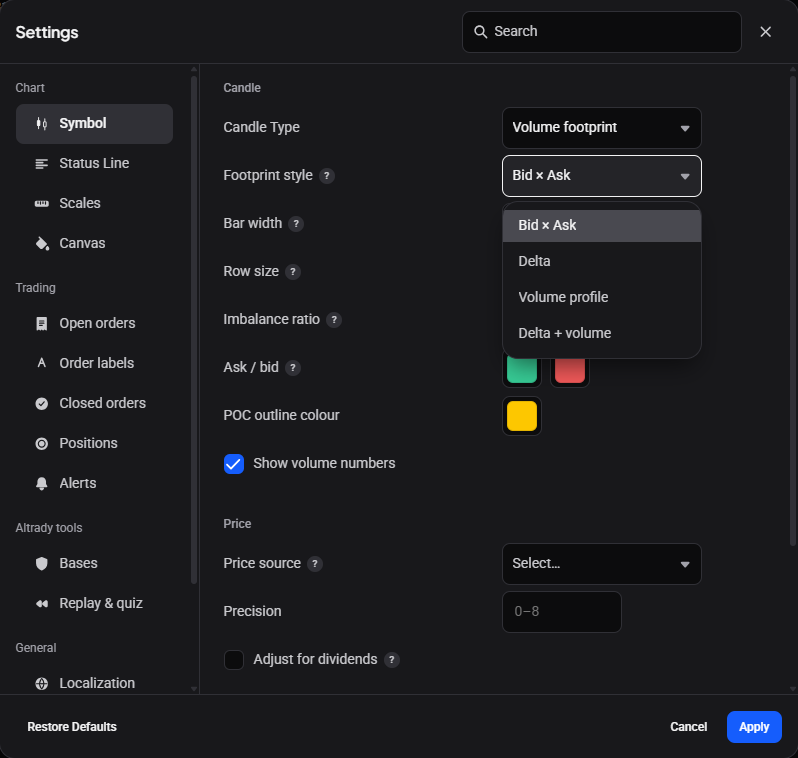
Once the chart type is Volume footprint, the Symbol tab shows a Footprint style setting with four views:
- Bid × Ask: buy and sell volume side by side for each price row.
- Delta: the difference between buy and sell volume at each price.
- Volume profile: the total volume traded at each price.
- Delta + volume: a histogram of both.
Pick the one that answers the question you are asking of the candle.
Fine-tune the look
The same tab has these settings for the footprint:
- Bar width: how wide each candle is drawn.
- Row size: how much price each row covers.
- Imbalance ratio: how lopsided buying against selling has to be for a row to be highlighted (in the Bid × ask style).
- Ask / bid: the colours of the buy (ask) and sell (bid) sides.
- POC outline colour: the colour that outlines the row with the most volume, the point of control (not in the Delta + volume style).
- Volume / value area: the two colours used in the Delta + volume style.
- Show volume numbers: shows the volume figures inside each row (not in the Delta + volume style).
Changes preview on the chart while the settings window is open.
For the rest of the chart settings, see An introduction to SuperChart.
Still stuck?
If the footprint is greyed out or the upgrade window opens, the market or your plan does not include it: try the Binance Futures BTC/USDT preview, or check your plan in your account. If it still looks wrong, reach out through support chat inside Altrady and the team will take a look with you.