
How do I add and configure indicators on my chart?
To add an indicator like RSI, MACD, Bollinger Bands, or a moving average to your chart, open the Indicators button above the chart, search for the indicator by name, and click it to add it. It appears instantly, either drawn over the price or in its own panel below the chart, depending on the type. You can adjust every indicator’s period, color, and line style afterward through its settings gear icon, and remove it just as easily.
Open the indicators list
Above your chart, look for the Indicators button (sometimes shown as an “f(x)” icon depending on your chart layout). Clicking it opens a search box where you can type the name of what you’re after: “RSI”, “MACD”, “Bollinger”, “Moving Average”, and so on. Altrady’s charting is built on a full trading platform library, so the list covers the standard set: moving averages (simple, exponential), oscillators (RSI, Stochastic), volatility bands (Bollinger Bands), trend tools (MACD, ADX), volume-based indicators, and many more. Scroll or keep typing to narrow it down.
Add it to the price pane or its own panel
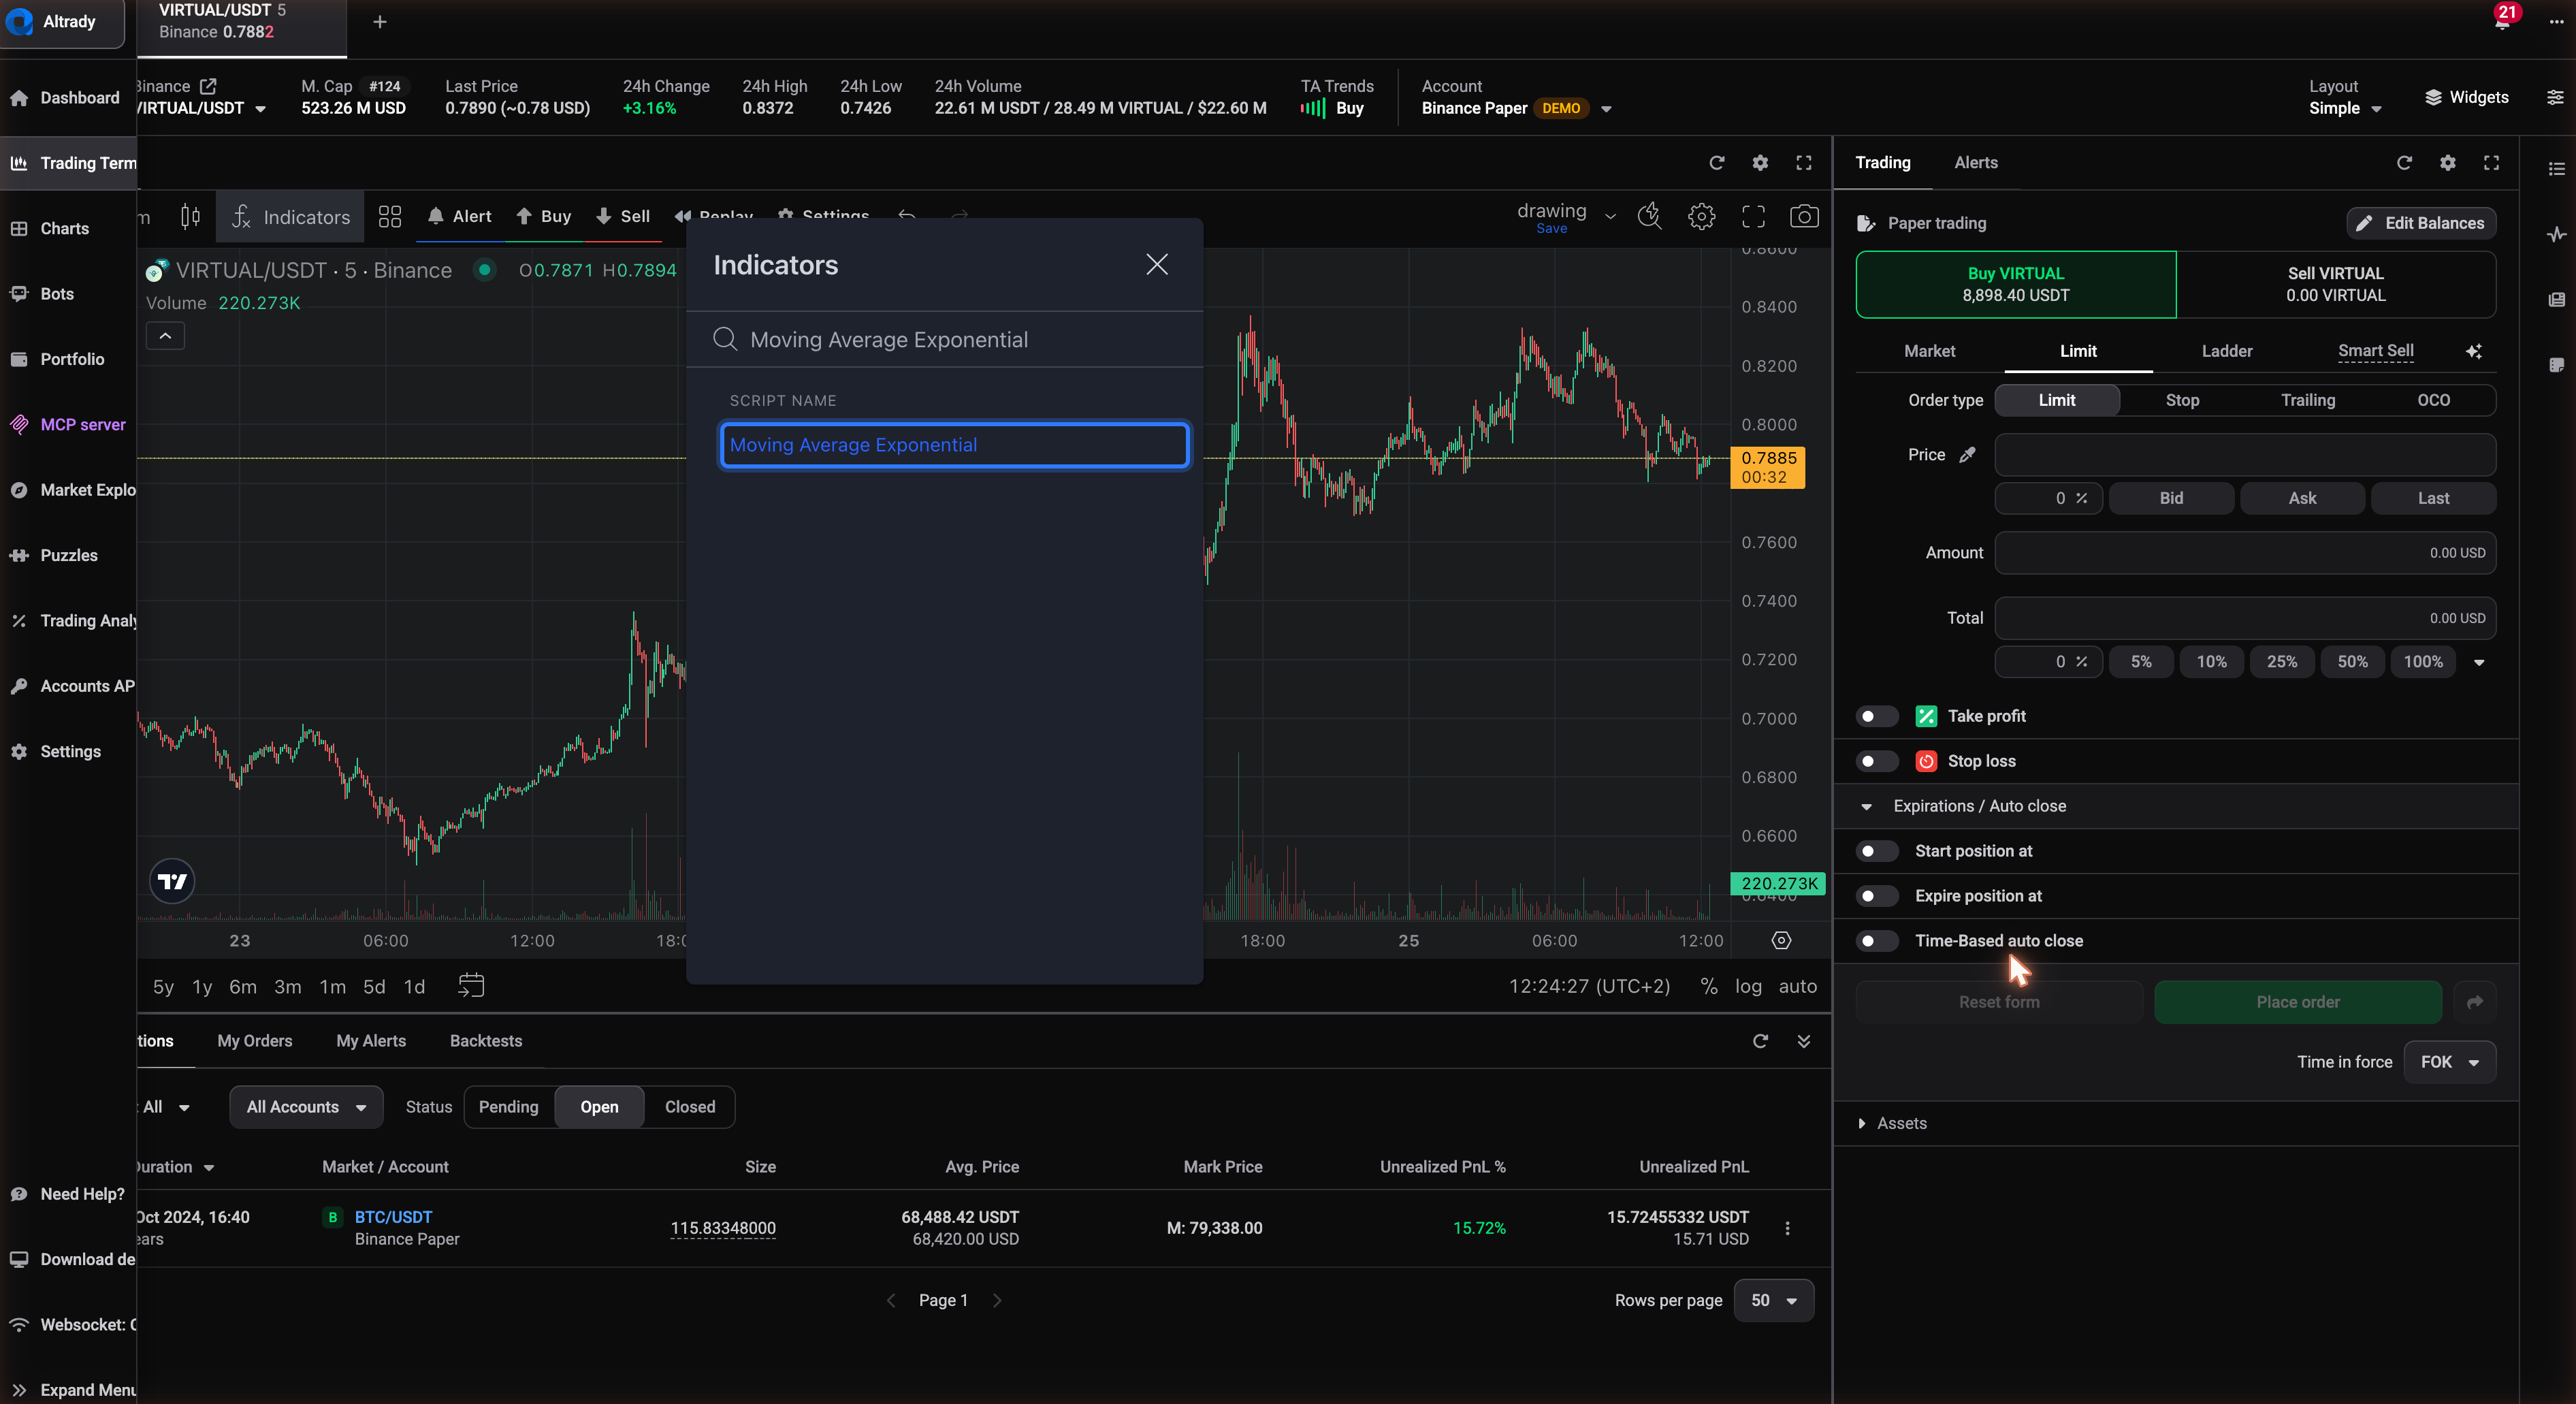 🔍 Click the image to see a larger version
Click an indicator in the search results and it’s added to the chart right away, no further confirmation needed. Where it lands depends on what kind of indicator it is:
- Overlays (moving averages, Bollinger Bands, and similar) draw directly on top of the price candles, in the same pane, since they share the same price scale.
- Oscillators and separate-scale indicators (RSI, MACD, Stochastic) open in their own panel underneath the main chart, because their values (like 0-100 for RSI) don’t match the price scale.
Don’t worry about picking the “right” one: the chart places each indicator correctly on its own. You can add several indicators at once and stack multiple panels below the price chart.
Edit an indicator’s settings
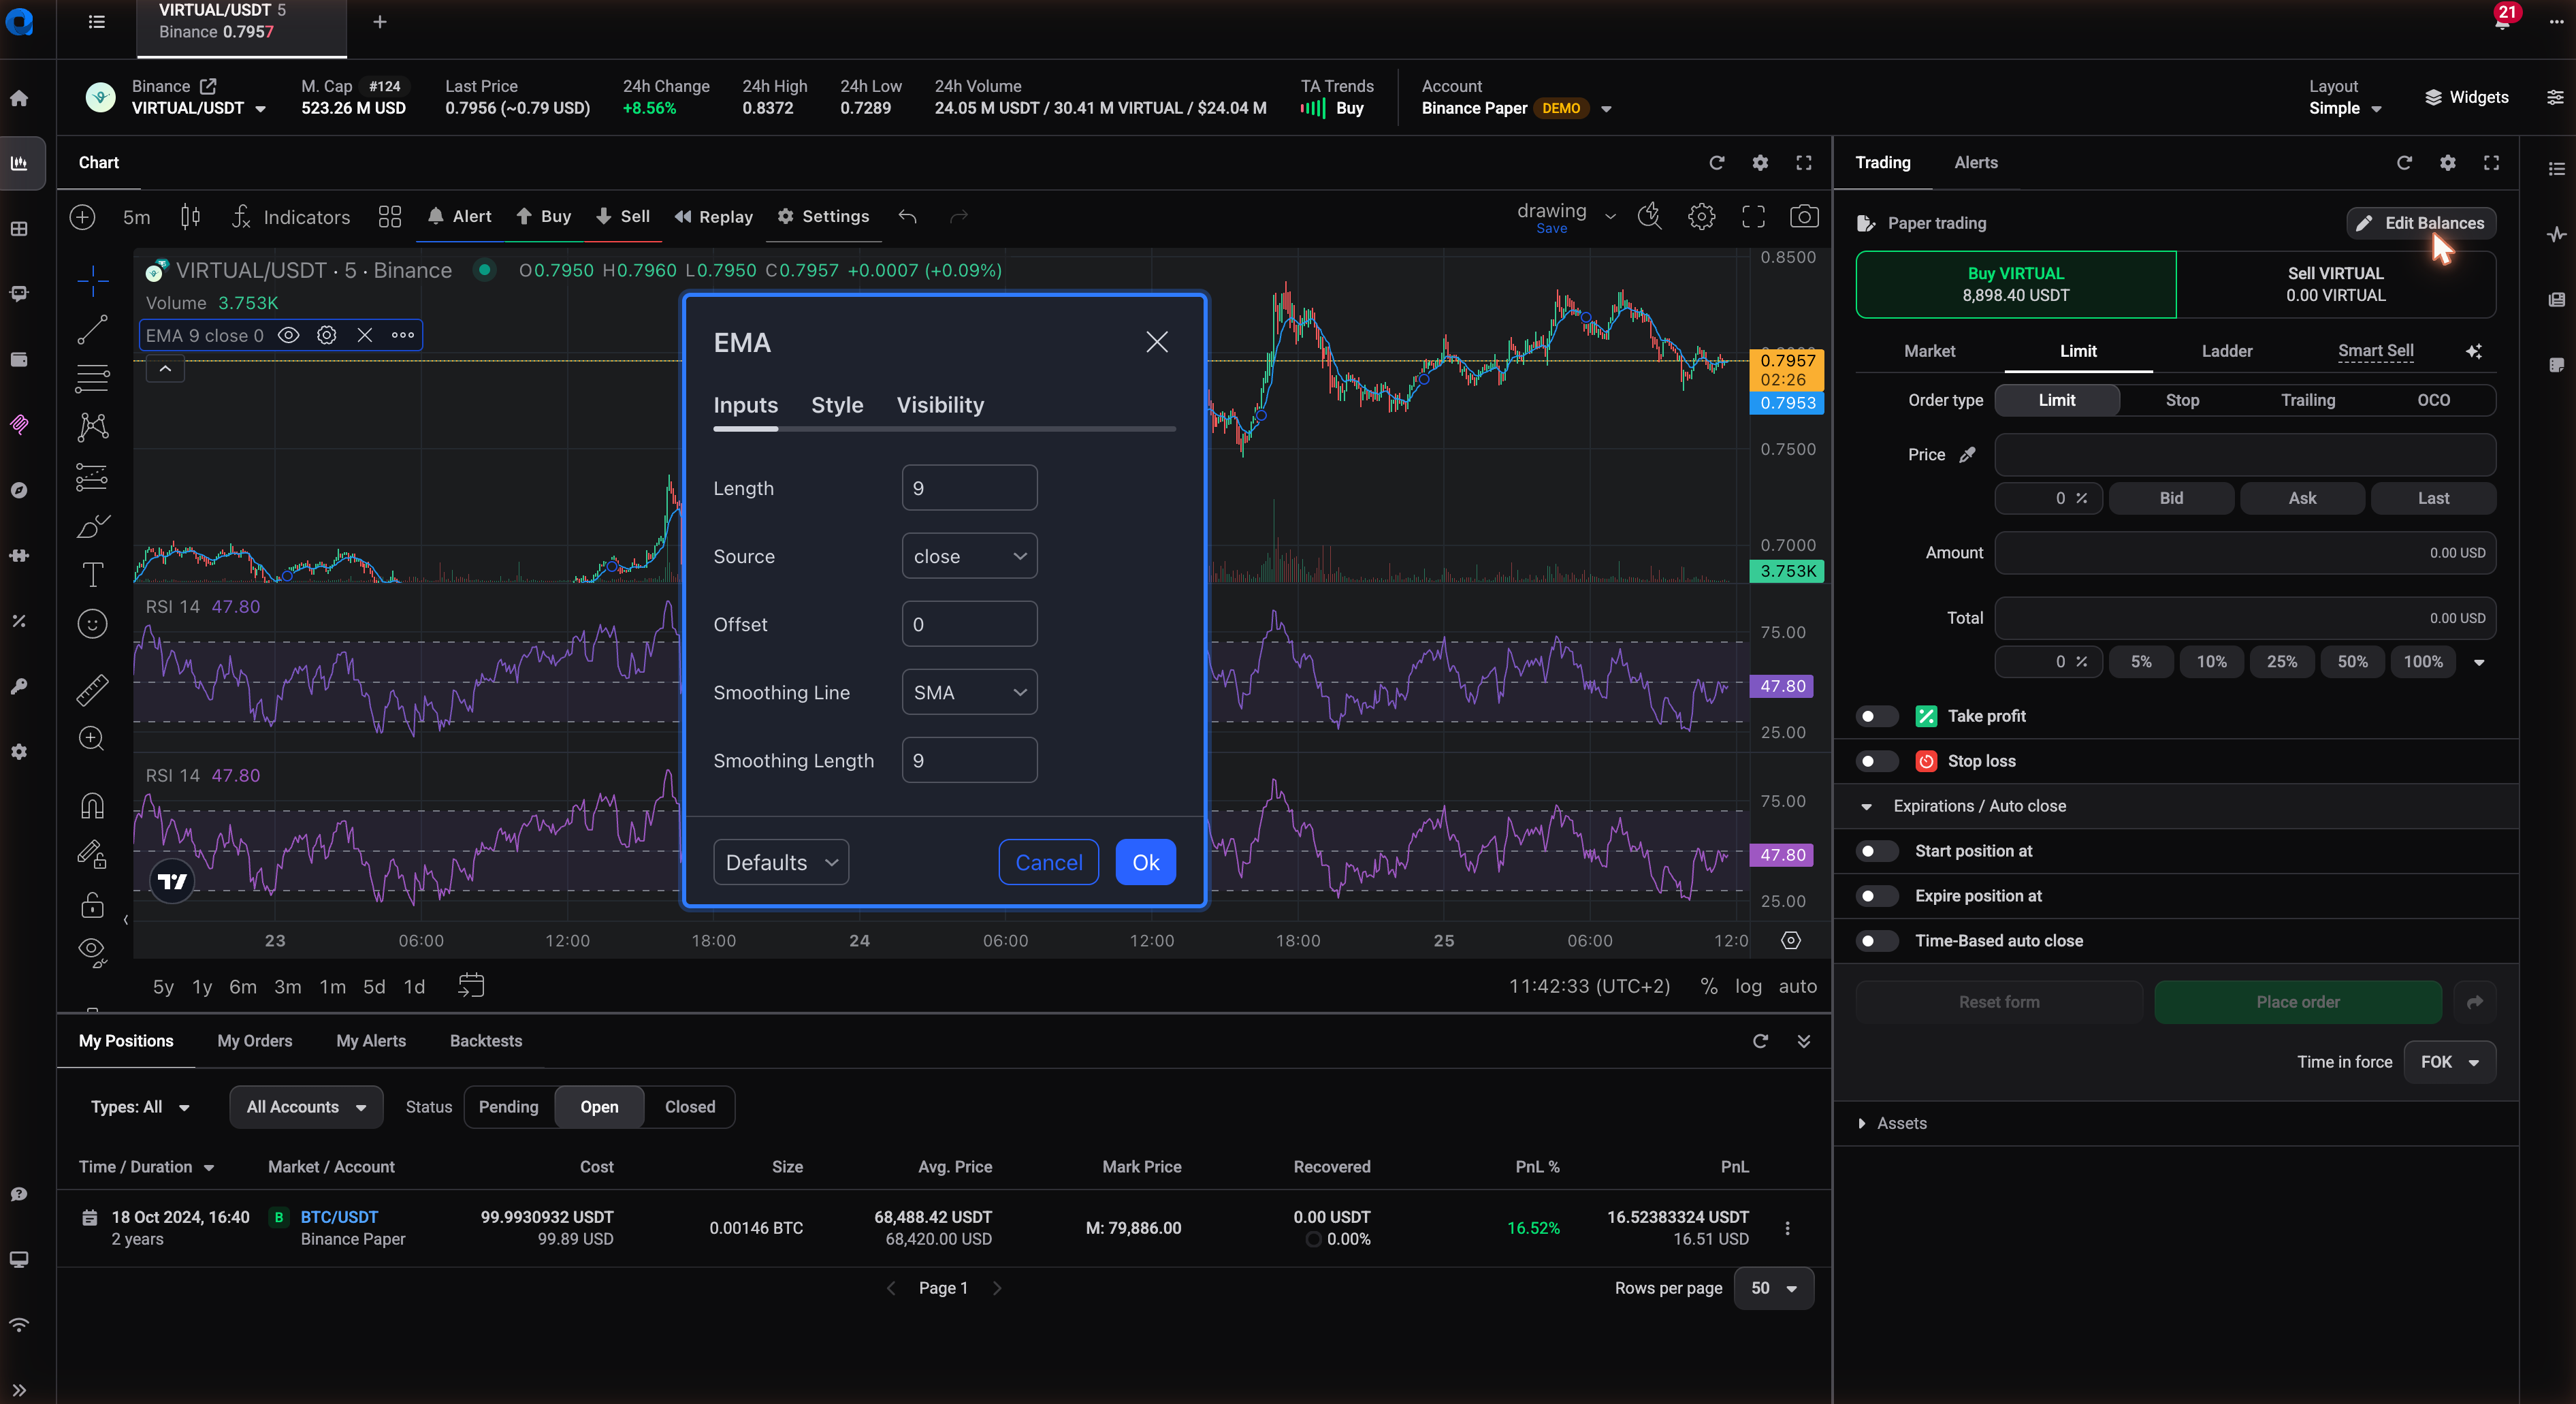 🔍 Click the image to see a larger version
Once an indicator is on your chart, hover over its name (either on the price chart itself or in its own panel) to reveal a small toolbar with a gear icon. Click the gear to open its settings, which are split into three tabs:
- Inputs: the numeric settings that define how the indicator is calculated, like the period length (for example, changing a moving average from 20 to 50) or the standard deviation multiplier on Bollinger Bands.
- Style: the visual side, including line color, thickness, and line style (solid, dashed, dotted).
- Visibility: which timeframes the indicator is shown on.
Changes apply immediately so you can see the effect on the chart as you adjust values. This is also where you’d change an indicator’s source (Close, Open, High, Low) if the indicator supports it.
Remove an indicator
To take an indicator off the chart, hover over it to bring up its toolbar and click the close (X) icon next to the gear. It disappears immediately, along with its panel if it had one. This doesn’t affect any other indicators or drawings still on the chart.
Save your setup as a reusable template
Once you’ve got an indicator combination and settings you like, whether it’s a single RSI tuned to your preferred period or a full stack of moving averages, MACD, and Bollinger Bands, you don’t have to rebuild it by hand on every market. Save it as a study (indicator) template from the indicators menu, give it a name, and it stores just your indicators and their settings, separate from drawings or the overall chart layout. Load that template on any other market or timeframe and the same indicators appear with the same settings applied.
This is a different save type from a full chart template, which also captures your layout and drawings. For saving and loading complete chart setups across markets, see /en/charts/how-do-i-save-and-reuse-a-chart-template.
A note on chart overlays you didn’t add
If you have an open position or a running bot on the market you’re viewing, you may see extra markers or lines on the chart, entry price, stop-loss, or bot grid levels, for example. Those aren’t indicators you added: Altrady draws them automatically from your trade data so you can see your position on the chart at a glance. They’re separate from anything covered here and can’t be edited through the indicator settings gear.
Still stuck?
If an indicator isn’t behaving the way you expect, or you can’t find one you’re looking for, reach out through support chat inside Altrady and the team can take a look.