
Base Trading in Altrady: QFL, CBS and the Base Scanner
Altrady brings together several tools for a style of trading called Base Trading. Because those tools (the Base Scanner, CBS signals, bases on the chart, notifications) are closely related, this overview is the place to start: it explains where Base Trading came from, how a base is detected, defines the terms you’ll meet throughout these articles, and compares Altrady’s scanning algorithms. For the tools themselves, see What is the Base Scanner?, the Bases widget, and Crypto Base Scanner (CBS) signals.
Where Base Trading came from: QFL
Base Trading was inspired by the QFL method, developed in 2017 by the Canadian trader known as QuickFingersLuc. QFL is a manual method: you analyse charts to locate bases. A base is drawn at the bottom of a dip that showed a strong recovery (a bounce) after a panic sell. Luc noticed that on some pairs, once price broke through a base it would quickly return to that level. By drawing bases on 4-hour (or higher) timeframes going back up to a year, and measuring how reliably price returned to each one, a pair with a high success rate became a good QFL candidate.
For a walkthrough of the manual method, there’s a video series made by a QFL mentor.
From QFL to CBS and the Base Scanner
Also in 2017, Altrady’s founder Benoist Claassen built an automated way to find and assess bases, using an algorithm of his own rather than copying QFL. Bases were defined a little differently, suited to algorithmic, higher-frequency trading. The system drew bases, accumulated statistics for each pair (median drop, median bounce, success rate and more), and sent a signal when a base was cracked. This became CryptoBaseScanner (CBS).
Where QFL favoured a few high-success, large-drop pairs traded manually and infrequently, CBS was built for a more automated style: entry signals across many markets at higher frequency, handled by signal bots so trading can continue while you’re away. That means more frequent trades, low involvement, and smaller profit per trade. CBS has since been refined and uses three proprietary algorithms (see the table below).
Today the pieces fit together like this:
- The Base Scanner finds and draws bases, tracks their statistics, and can notify you when one cracks. It’s included on the Essential and Premium plans (a Trial gives access too).
- CBS signals turn cracked bases into automated buy signals for bots, and are available on every plan.
How a base is detected
What the manual QFL trader does by eye, the algorithm does by measurement. It reads the market in Heikin Ashi candles rather than normal ones. Heikin Ashi averages each candle with the one before it, which smooths away single noisy candles and leaves clean runs of colour: a stretch of red for selling, a stretch of green for buying. Those runs are what the algorithm looks for.
A base is formed in three steps:
- A run of consecutive red candles, where the total drop is significantly large for that market. This is the panic sell.
- A run of consecutive green candles straight after it, where the rise back up is also significantly large. This is the market being bought back up: the bounce.
- The turning point between the two is registered as a valid low point, and its price becomes the base: a support level buyers have just visibly defended.
From then on the scanner only has to watch that level. While price stays above it the base is uncracked. When price falls through it the base is cracked, and the scanner starts measuring how deep the drop goes and how long it takes to come back. Everything else (median drop, median bounce, success rate) is built from those measurements across that market’s earlier bases.
What makes a base interesting is the character of the crack. Historically, cracks caused by a panic move, a fast steep drop rather than a slow grind down, have shown a high rate of price returning to the base level, which is what the success rate and 90% respected in figures measure over past data. The median drop then describes how deep those returns typically started from, which is why the chart draws the 0.5x and 1x median drop lines beneath a cracked base.
The thresholds for “significantly large” and the timeframe the candles are read on differ per algorithm, which is why a slower algorithm finds fewer and deeper bases. See the table further down.
These are statistics about past behaviour on that market, not a prediction and not a signal to trade. A base that bounced reliably before can still keep falling.
Commonly used terms
 🔍 Click the image to see a larger version
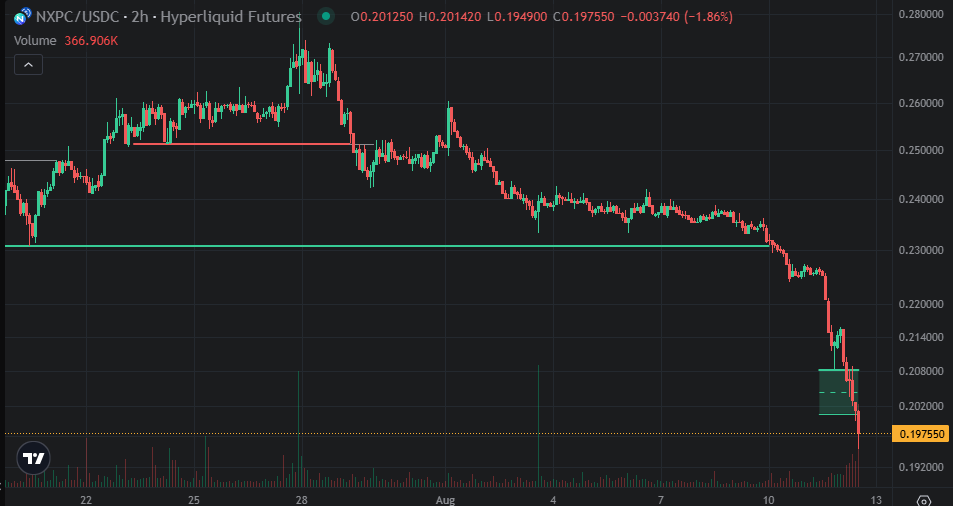
Base. A support level, drawn as a horizontal line on the chart, that price previously bounced from. Enable Bases in the chart settings to see them. A base is coloured by its state:
- Cracked base (green by default): price has passed through the base from above to below by at least 3% (and met certain other criteria). In QFL terms, a crack is a panic-sell candle dropping below the base; at or below that candle is seen as a safer buying zone.
- Uncracked base (grey/white by default): price hasn’t crossed the base, or not deeply or long enough to count as cracked. Uncracked bases are temporary: they can move or be removed (a base breached by less than 3% is moved down), and for the Day Trading, Conservative and Position algorithms they’re tidied so they sit at least 2% apart.
- Respected base (red by default): after a crack, price has returned fully to the base after the first green Heikin Ashi candle on that timeframe.
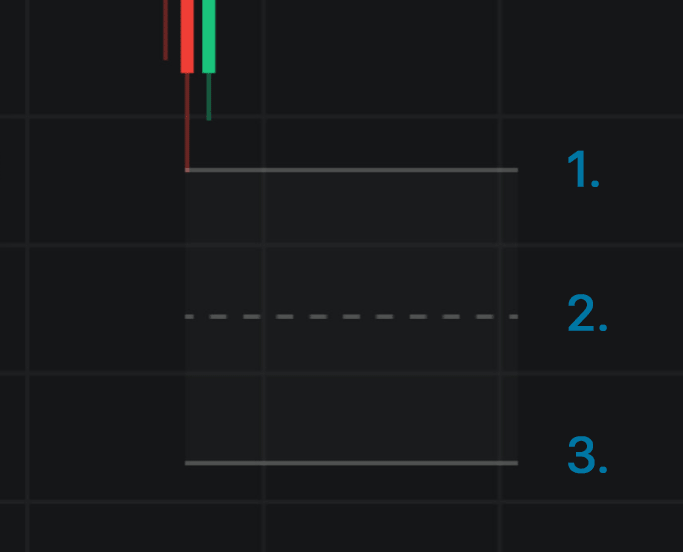
The selected base. The base you’re currently inspecting (change it in the Base Info widget). On the chart a selected base is marked out at three levels:
- the base itself
- a dashed line at 0.5x the median drop
- a solid line at 1x the median drop
with a shaded band in the base’s own colour marking the zone between them.
 🔍 Click the image to see a larger version
Median. A type of average: order the values and take the middle one (or the mean of the two middle values). The median is preferred here because it isn’t skewed by the occasional extreme outlier the way a plain (mean) average is.
Median drop. The drop is how far below the base price has fallen, as a percentage. The median drop is the median of those drops across all cracked bases for that market over the last 1000 hours (about six weeks).
Median bounce. The bounce is the first recovery after a base forms: using Heikin Ashi candles, it’s the distance between the lowest and highest points of the first green set of candles. The median bounce is the median across all bounces for that market over the last 1000 hours.
Success rate. The share of that market’s bases, over the last 1000 hours, that cracked and were then respected, regardless of how big the drop was. A base that is currently cracked counts in the denominator but not the numerator, so the success rate can read below 100%.
DCA (Dollar-Cost Averaging). Not specific to Base Trading, but common in it: buying more of a coin as the price drops, to bring your average entry price down so the position can exit sooner and more profitably. Later buys are usually larger than earlier ones (a common approach is to double the size at each level) for more averaging effect; in manual Base Trading the earliest buys are often small “nibbles”.
QFL. QuickFingersLuc, the originator of the QFL method that CBS and the Base Scanner were derived from.
The scanning algorithms
An algorithm is a set of parameters and a calculation method for finding a market’s bases. Altrady’s Base Scanner offers four algorithms; CBS uses three of them (Day Trading, Conservative and Position, not Original).
| Algorithm | Chart timeframe | Bases stay active | How bases are found | Drops & speed to respect |
|---|---|---|---|---|
| Original (Base Scanner only) | 1 hour | 12 hours | A fixed percentage for all markets; uses the body of the candle (not the wick) for lows, and a fixed percentage for bounces. | The original method, now replaced by the three below. |
| Day Trading | 1 hour | 12 hours | Heikin Ashi candles for swings and a relative percentage for the bases; bases tidied to at least 2% apart; a base cracked by less than 3% is removed and lowered. | Quickest to respect; shallowest drops. |
| Conservative | 2 hours | 24 hours | As Day Trading. | Medium speed; medium drops. |
| Position | 4 hours | 48 hours | As Day Trading. | Slowest to respect; deepest drops / highest returns. |
Because the lists, charts, statistics and notifications all follow whichever algorithm you’ve selected, a base that appears on Day Trading may not appear on Position. That’s expected, not a fault. Set the chart to the algorithm’s timeframe (1h for Day Trading and Original, 2h for Conservative, 4h for Position) to see its bases. You can compare how the three CBS algorithms have performed in the CBS Monthly reports.
How base trading works in practice
Base trading with Altrady’s tools follows a simple shape: wait for a base to crack, build a position as price falls, and exit when price recovers to your target. The tools are built to support that workflow; they don’t decide it for you, and nothing here is a recommendation to trade any particular market or level. The scanner’s statistics describe past behaviour only; a base that bounced reliably before can still keep falling, so size and manage risk accordingly.
- Wait for the crack. A base only becomes a candidate once it cracks. You can watch for that on the chart, be alerted to it, or hand it to a bot: the three modes below.
- Build the position (averaging down). As price falls further below the base, base traders commonly add to the position with larger orders at lower prices, so the average entry price comes down and a smaller recovery is enough to reach profit (the DCA idea, defined above). In Altrady this is handled by a DCA position or a bot’s safety orders, rather than placed by hand each time.
- Exit at your target. The position closes when price recovers to the profit target you set, as a take profit on the position.
There are three ways to run this, depending on how hands-on you want to be, all using the same base logic:
- Manual: find and judge bases yourself on the chart. See What is the Base Scanner?.
- Semi-automated: let the scanner notify you when a base cracks, then enter quickly: an order preset places your prepared entry in one click when the alert arrives. Set alerts up in Find and filter bases.
- Automated: let CBS signals drive a DCA/signal bot, so entries happen on the bounce logic without you watching. See Crypto Base Scanner (CBS) signals.
Where to go next
- What is the Base Scanner?: seeing bases on the chart and reading the Base Info widget.
- Find and filter bases: the Bases widget, and setting up notifications.
- Crypto Base Scanner (CBS) signals: automated buy signals for bots.
Still stuck?
If a term or number here doesn’t match what you’re seeing in the app, reach out through support chat and the team can take a look with you.