
What is the Base Scanner, and how do I read bases on the chart?
The Base Scanner watches your markets for support levels that price has broken through, flags them as bases, and tracks what happens next: does price climb back above the level (a bounce), or keep falling? For each base it builds statistics from past behaviour, so you can judge whether a level is worth watching. It never tells you to buy, sell, or hold, and past bounces don’t guarantee the next one.
For what a base is, how the algorithm detects one, and the terms used here (cracked, respected, median drop, success rate), start with Base Trading in Altrady: an overview. This article covers seeing bases on the chart and reading the Base Info widget. The Base Scanner is included on the Essential and Premium plans (a Trial gives access too).
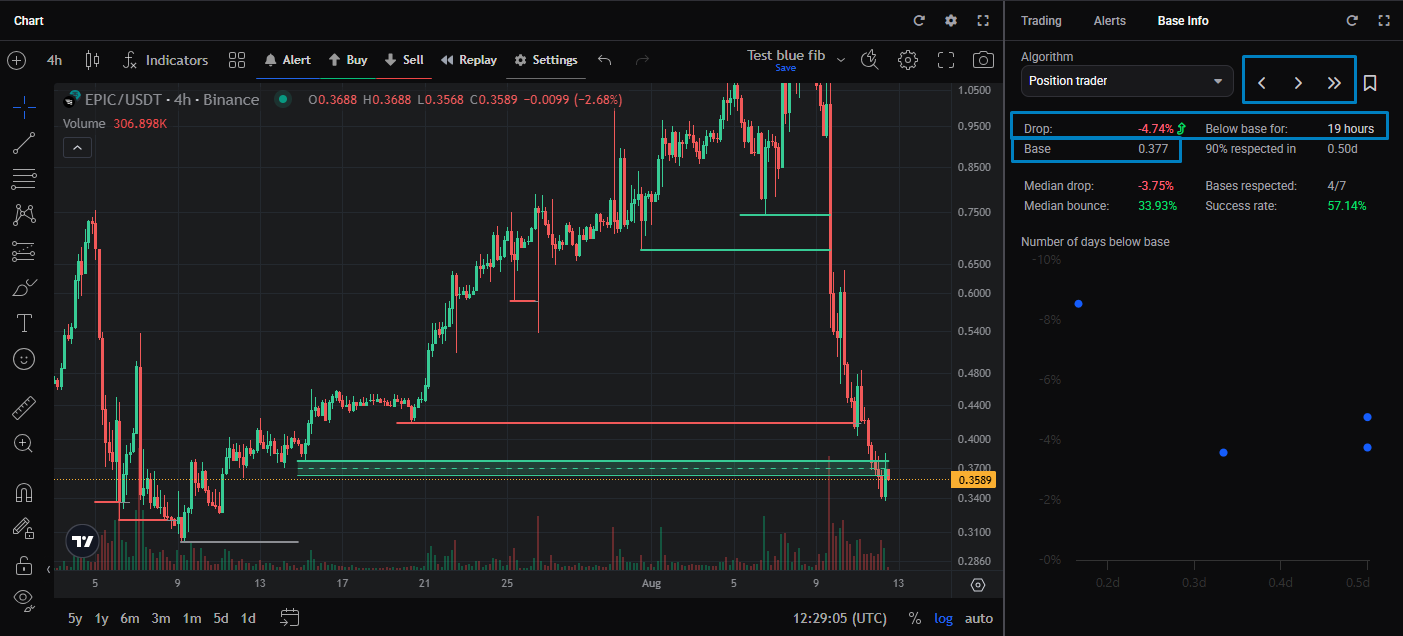 🔍 Click the image to see a larger version
See bases on the chart
Turn on Bases in the chart settings and the scanner draws them as horizontal lines on the market you’re viewing. Each base is coloured by its state: cracked, uncracked, or respected (the overview explains what the colours mean).
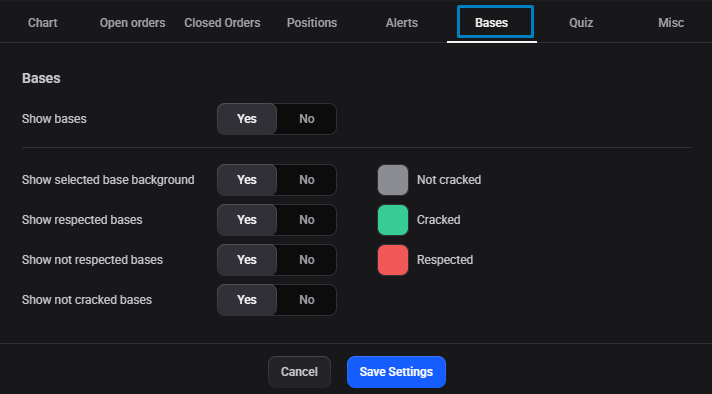 🔍 Click the image to see a larger version
View the chart on the algorithm’s timeframe. Bases are calculated on the timeframe the algorithm uses, so set the chart to match, otherwise a base may not appear where you expect:
- Original and Day trading: 1h (60m)
- Conservative trader: 2h (120m)
- Position trader: 4h
Set the chart to Heikin Ashi candles too: those are the candles the algorithm reads to find the base, so the drop and the bounce it measured are only visible as it saw them on Heikin Ashi.
The base the scanner treats as current is selected by default (usually the most recent). Beneath a selected base you’ll see two more lines and a shaded band in the base’s own colour: a dashed line at 0.5x the median drop and a solid line at 1x the median drop, so the typical drop depth is easy to read at a glance.
Read the Base Info widget
The Base Info widget shows the numbers behind the selected base. It’s also where you switch the Algorithm and step between bases (the arrows), so it’s the panel to keep open while you weigh a base up. Open it from the widget picker (see what each widget shows).
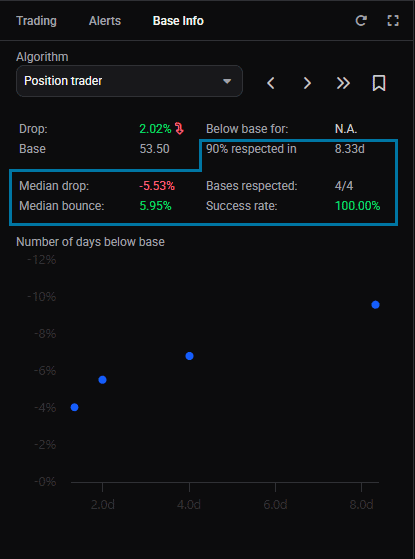 🔍 Click the image to see a larger version
Some of its fields describe the base you’re looking at right now:
- Base: the base’s price.
- Drop: how far below the base price currently is.
- Below base for: how long price has been below the base since it cracked.
The rest are that market’s statistics (all defined in the overview):
- Median drop and Median bounce: the typical drop and recovery for this market.
- Success rate and Bases respected (for example 18/19): how reliably this market’s bases have been respected.
- 90% respected in: the time within which 90% of this market’s bases recovered.
Below these, a Number of days below base chart plots how far past bases dropped against how long they stayed below the base.
Choose the algorithm
The scanner can run one of four algorithms, and the one you pick changes which bases are found and how their statistics are calculated. Switch between them in Settings > Base Scanner Rules, or from the Algorithm selector on the market:
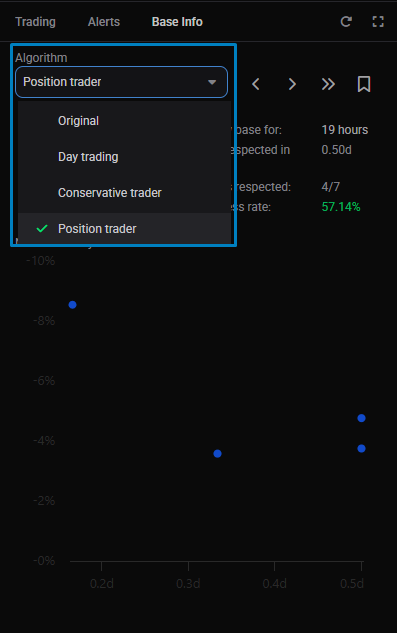 🔍 Click the image to see a larger version
- Original
- Day trading
- Conservative trader
- Position trader
They use the same detection logic, but on different timeframes and with different thresholds, which is why a slower algorithm finds fewer and deeper bases. The full comparison is in the overview’s algorithm table. Lists, charts, statistics and notifications all follow the algorithm you’ve selected, so a base that shows on Day trading may not appear on Position trader. That’s expected, not a fault.
Feed bases to a bot
You don’t have to watch for cracks by hand. A cracked base can drive a CBS signal into a DCA/signal bot, so the bot enters on the same bounce logic automatically. See Crypto Base Scanner (CBS) signals and How to set up a DCA/signal bot.
Still stuck?
If a market you expect to show bases on looks empty, first check that Bases are enabled in the chart settings and which algorithm is selected: a base may simply not exist on the algorithm you’re viewing. If you think a base should have been respected but it’s not, check that you have the correct timeframe set in the chart, and Heikin Ashi candles selected. If it still looks wrong, reach out through support chat and the team can check your account and plan.