
What do my trading stats mean? Reading the Stats report
ℹ️ Note
The Journal reports are included with the Essential and Premium plans. See the pricing page to compare.
The Stats report in your Trading Journal is the headline read on your closed trades: one screen that says how much you made, how often you won, and how your wins and losses balance out. This guide explains each number so the report tells you something instead of just sitting there.
Everything here is calculated from closed trades you have marked reviewed, for the period and accounts set in the filters at the top right. Unreviewed positions are left out, which is the usual reason a report covers fewer trades than you expected; see how do I review, rate and tag my trades. These are historical figures: past results do not indicate future performance. Use the Net P&L / Gross P&L toggle to see the numbers with or without fees.
The four headline tiles
 🔍 Click the image to see a larger version
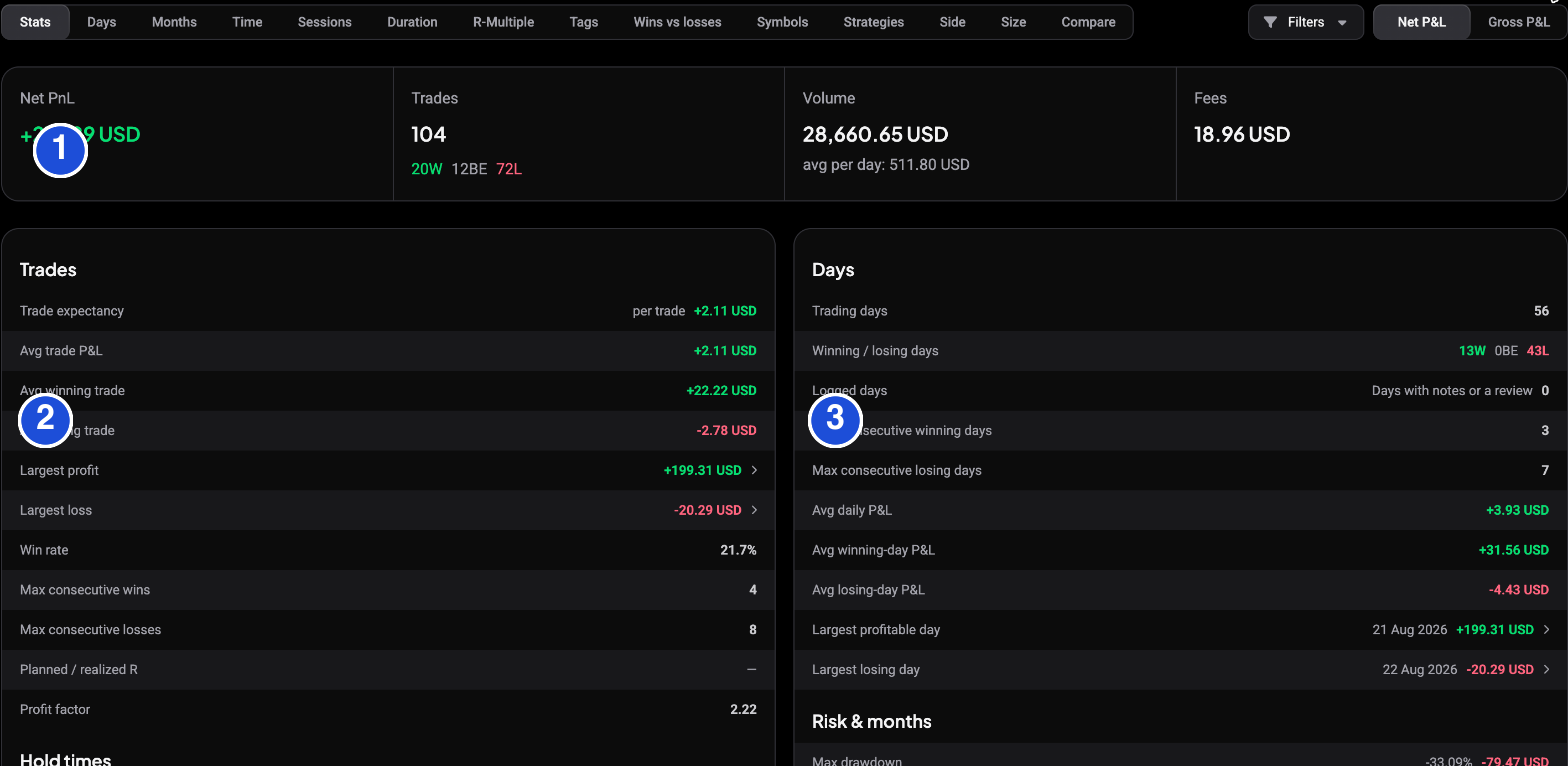
The report is one long panel. The markers above map to how it is laid out: 1 the four headline tiles across the top, 2 the Trades column on the left (per-trade stats: expectancy, win rate, profit factor, trade streaks and hold times), and 3 the Days column on the right (per-day stats). A Risk & months block sits beneath the Days column (drawdown and monthly figures), and the Cumulative PnL and Daily PnL charts run along the bottom.
Across the top: Net PnL (your total profit or loss after fees), Trades (the count, with the win / breakeven / loss split beneath it), Volume (how much you turned over), and Fees (what trading cost you). The win/breakeven/loss split is worth a first glance: a lot of breakevens, for instance, is just a fact about how your exits land, and the report lets you see it rather than guess.
Expectancy and the average trade
 🔍 Click the image to see a larger version
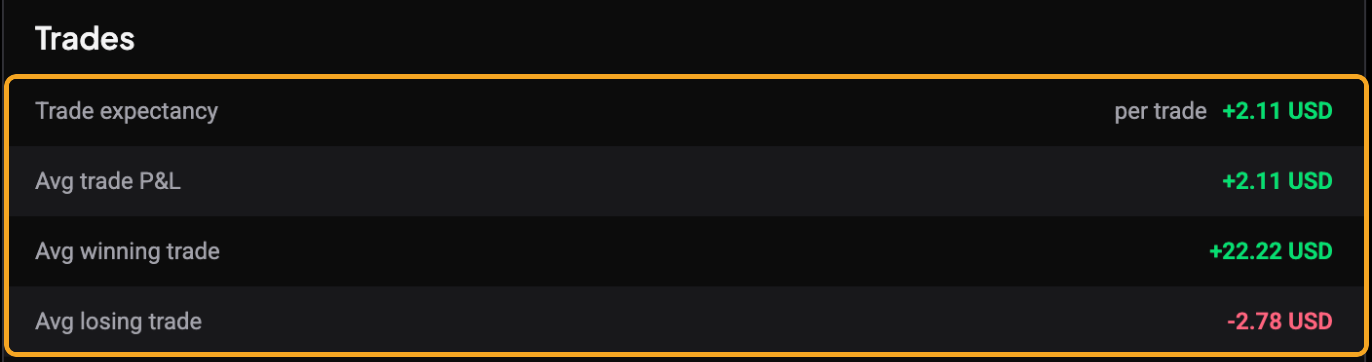
Trade expectancy and Avg trade P&L answer “what does a typical trade do for me?” Expectancy is the average result per trade across the whole set. A positive number means the average trade added to your account over this period; a negative one means it subtracted. Avg winning trade and Avg losing trade show the two sides that average is built from.
Win rate and profit factor read together
 🔍 Click the image to see a larger version
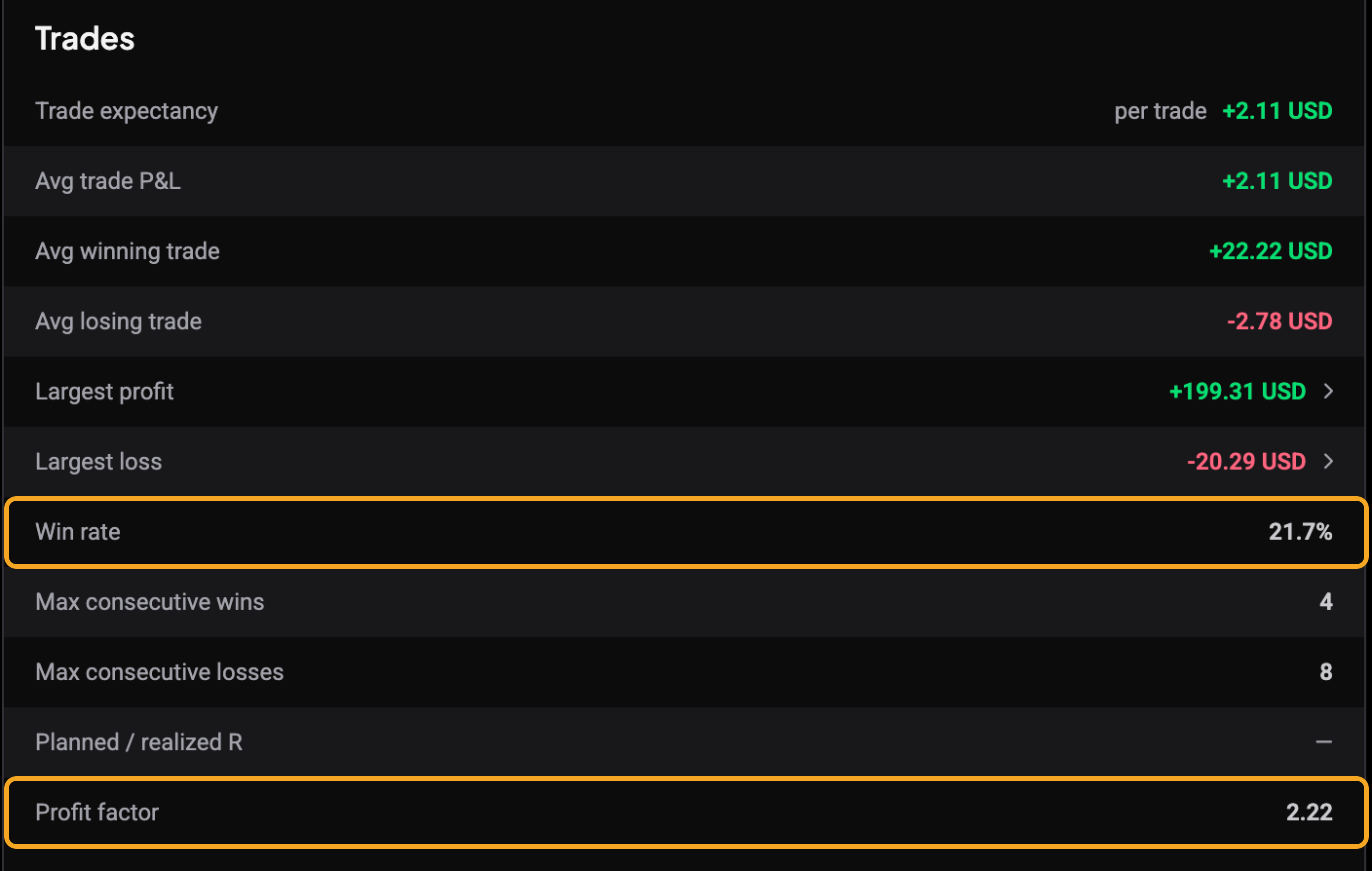
This is the pair people most often misread, so read them together. Win rate is the share of trades that closed positive. Profit factor is gross profit divided by gross loss: above 1.00 means your winners outweighed your losers in total size, below 1.00 means the reverse.
A low win rate is not the same as losing money. A record can win only one trade in five and still be positive if the wins are far larger than the losses, because profit factor measures size, not frequency. The report shows both numbers side by side precisely so you can see which one is carrying you.
Streaks and drawdown
 🔍 Click the image to see a larger version
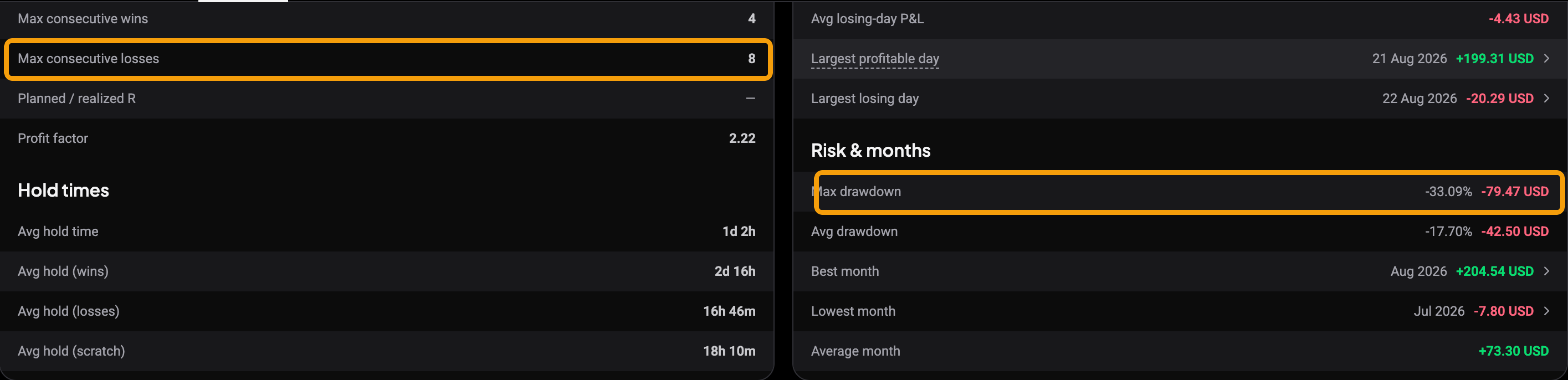
Max consecutive wins and Max consecutive losses in the Trades column show your longest runs of winning and losing trades; the Days column carries the same idea for winning and losing days. Max drawdown, in the Risk & months block, shows the deepest peak-to-trough fall in your cumulative closed-trade P&L, in both currency and percentage terms. Drawdown is the number that tells you how much variance your approach actually put you through: a strong end result can still have a painful dip inside it, and this is where you see it.
Hold times and the R columns
 🔍 Click the image to see a larger version
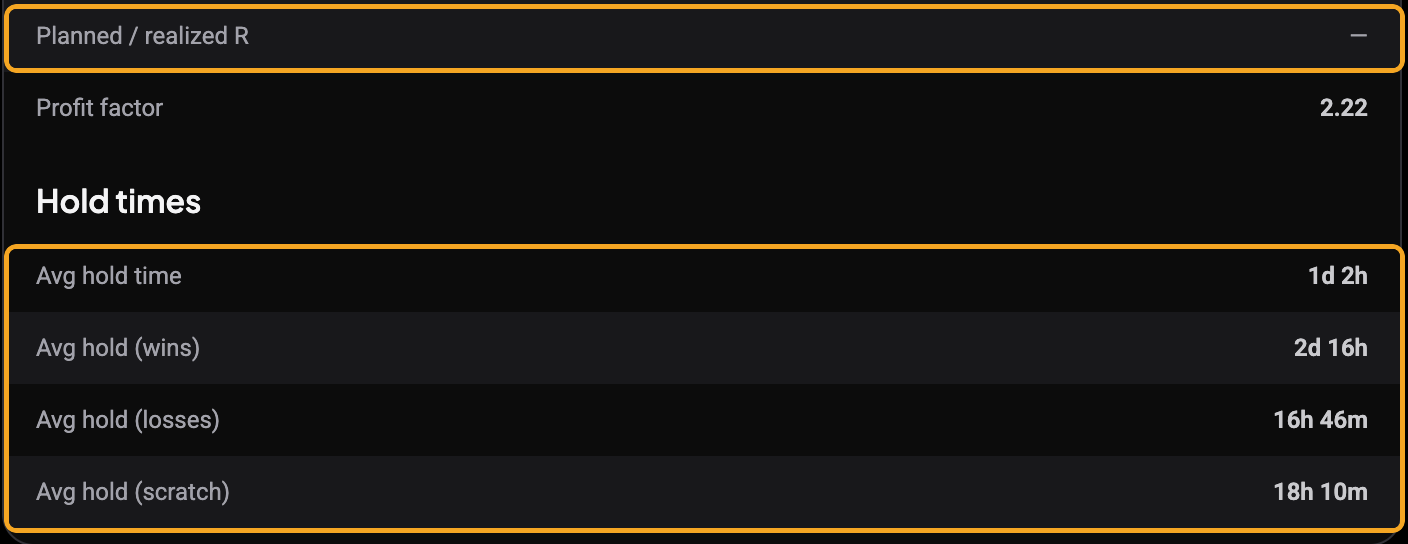
Hold times summarise how long your trades stayed open. The Planned / realized R and R-multiple figures describe risk-to-reward, and they only populate for smart positions opened inside Altrady, because R is measured from a stored stop loss. On trades synced or imported from an exchange these read as blank or “No R data”, which is expected, not a fault.
Reading it on your own record
The point of the Stats report is not a single verdict but a starting question. A negative expectancy points you at your losing trades; a profit factor sitting near 1.00 says wins and losses are almost cancelling out; a deep drawdown next to a positive total says the ride was rougher than the result suggests. Each one tells you which part of your history is worth opening next. To see where those results come from, use the breakdown reports: Finding where you make and lose money. For the day-by-day picture, see reading your Overview and Calendar.
Still stuck?
If a stat does not match what you expect, check the period, currency and account filters, and check that the trades are reviewed, since unreviewed positions are left out of every report. Then reach out through support chat in the app and the team can look at your account directly.