
How do I read my Trading Journal Overview and Calendar?
ℹ️ Note
The Journal reports are included with the Essential and Premium plans. See the pricing page to compare.
The Overview tab in your Trading Journal turns your closed trades into a set of numbers you can judge yourself by: how much you made, how often you win, and where the risk is going. This article walks through each panel so you know what you are looking at.
⭐ Important
Every figure on this page counts a position once, on the day it closed, and only once it is verified: automatically for bot positions and for positions whose buys and sells fully balance, or by you marking it as reviewed. Partial sells on a position that is still open do not count until that position closes.
The KPI panel
 🔍 Click the image to see a larger version
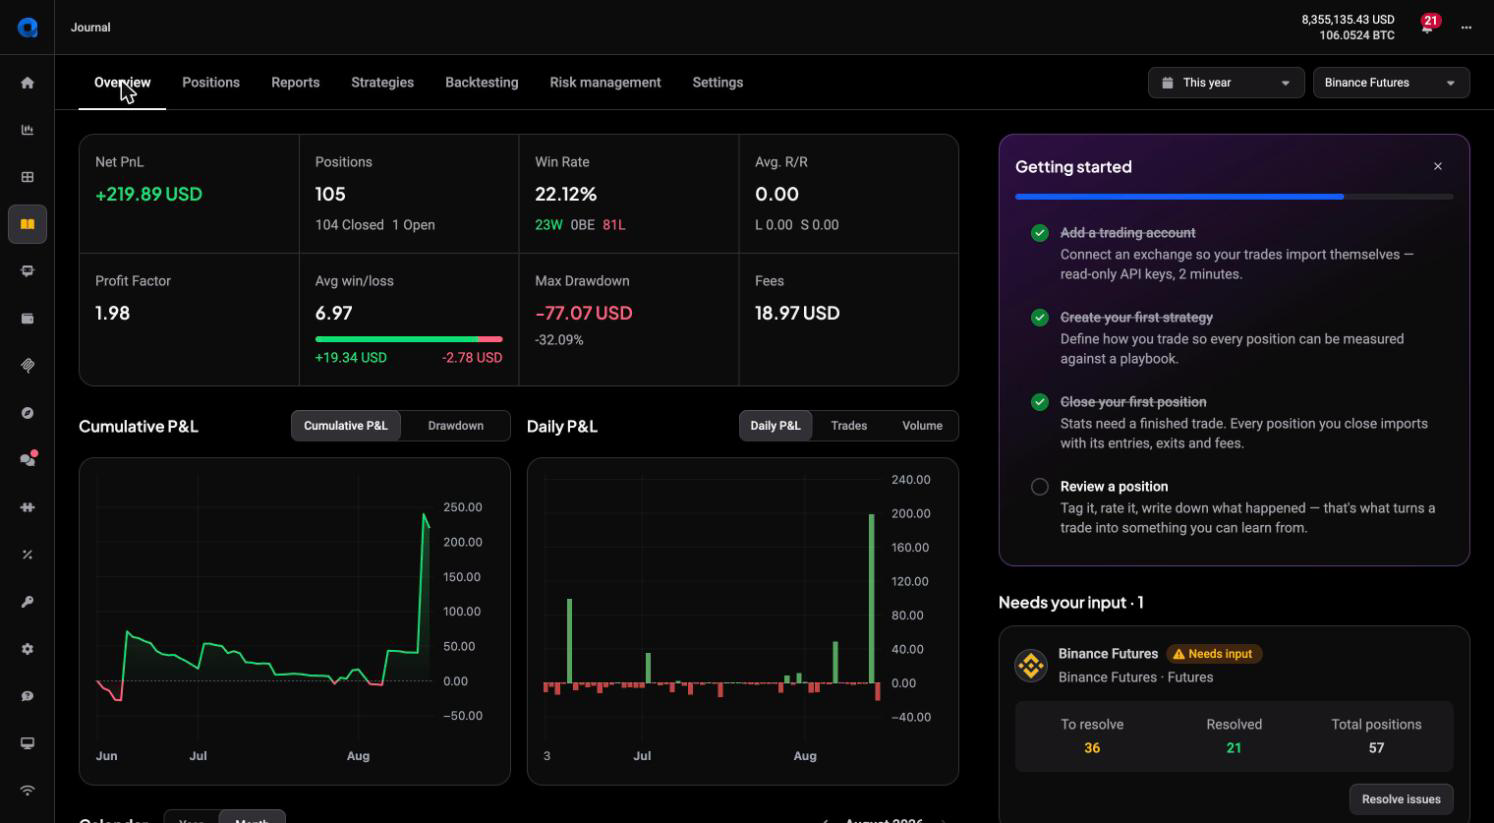
At the top of Overview sits a grid of tiles, built from your closed positions for the selected period:
- Net PnL: total profit or loss after fees, in your chosen currency.
- Positions: the total number in the period, with the closed and open split underneath.
- Win Rate: the percentage of closed trades that ended positive, with the win / breakeven / loss split underneath.
- Avg. R/R: your average realized risk-to-reward, split into long and short. This comes from the stop loss, so read the note below before relying on it.
- Profit Factor: gross profit divided by gross loss. Above 1.00 means your winners outweigh your losers in total size.
- Avg win/loss: your average winning trade next to your average losing trade, with a small bar showing the balance.
- Max Drawdown: the largest peak-to-trough drop in your cumulative closed-trade PnL, in currency and as a percentage.
- Fees: total trading fees paid across the period.
None of these numbers are advice. They describe what already happened so you can spot patterns.
Cumulative P&L and Daily P&L charts
Below the tiles, two charts plot the same data two ways. Cumulative P&L draws a running total across the period, so you can see whether your equity curve is trending up, flat, or sliding; a Drawdown toggle switches it to show the dips instead. Daily P&L shows each day as its own bar, green above the zero line and red below, and toggles let you view it as Trades or Volume instead. Hover any chart to read the exact value and date.
The Calendar
 🔍 Click the image to see a larger version
 🔍 Click the image to see a larger version
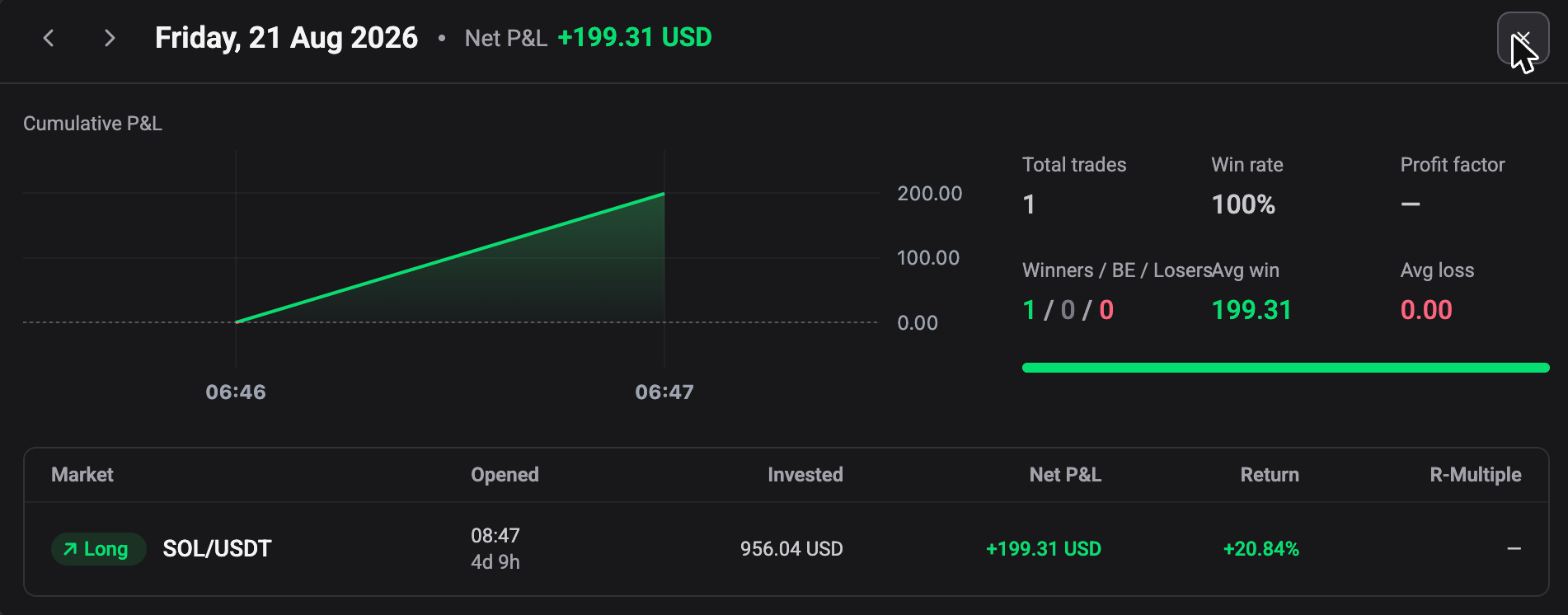
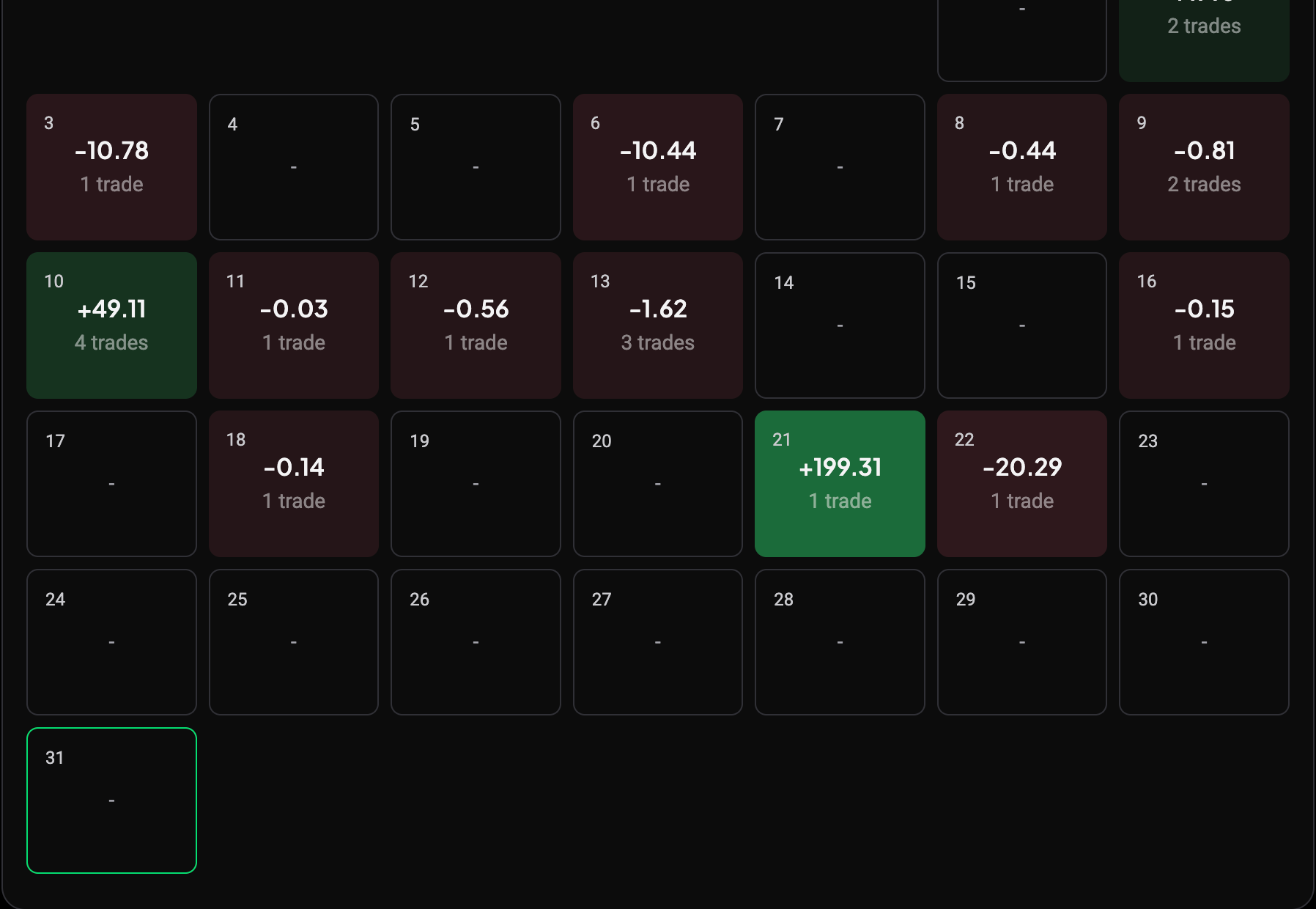
Under the charts, the Calendar gives you a day-by-day view. It opens in Month view, with each day shaded by result and showing that day’s PnL and trade count; switch to Year to see twelve months at once. Click any day to open a window with just that period’s closed positions, and click a trade there to jump to its full Review page.
Filters: Period, Currency, Account
The filters at the top right control the whole page. Period offers presets (Last 7 days, Last 30 days, Last 3 months, This year, Last year, and a custom range). The account selector switches between Live and Demo and lets you combine or isolate individual connected accounts, and a currency control sets which quote currency the figures convert into.
Changing any filter recalculates every panel. If a number looks off there are two things to check: your filters, and whether the trades you are expecting have been reviewed. Positions that still need review are excluded from every figure on this page, and so are positions that have not closed yet, which is the usual reason a period looks emptier than your trading was. See how do I review, rate and tag my trades.
The review prompts
Alongside Overview you will see a Getting started checklist and a Needs your input panel listing recent trades worth reviewing, such as a loss that used more than your usual risk or a win worth reflecting on. Click Review now on a card to open that trade’s Review page, or Skip to drop it. These are a shortcut into the review workflow, not part of the reporting numbers. For the rating, tagging and checklist workflow once you are on a trade, see how do I review, rate and tag my trades.
Deeper reports
The separate Reports tab breaks the same trade history down much further: by day, month, session, duration, R-multiple, tag, strategy, market, side and size, plus a Compare view and a Net / Gross P&L toggle. The core reports (headline stats, wins vs losses, symbols, side and days) are available from the Essential plan up; the rest are part of Premium.
Why R/R sometimes reads as zero
If you trade positions synced from your exchange or imported from your trade history, Avg. R/R often sits at 0.00. That is expected: risk and reward are calculated from a trade’s stop loss, and only smart positions created inside Altrady carry a stored take-profit and stop loss. Imported and synced trades do not include that data, so Altrady has nothing to calculate the ratio from.
Still stuck?
If a number still does not match what you expect after checking your filters and confirming the trades are reviewed, reach out through support chat inside Altrady and the team can look at your account directly.