
How do I set an alert on a trendline I've drawn?
A Trend Line Alert fires when price crosses a sloped line you have drawn on the chart, instead of a flat price level. You always start on the chart: draw the line, select it, then open the alert from the line’s own toolbar. There is no way to type in two points by hand.
Draw the trend line on the chart
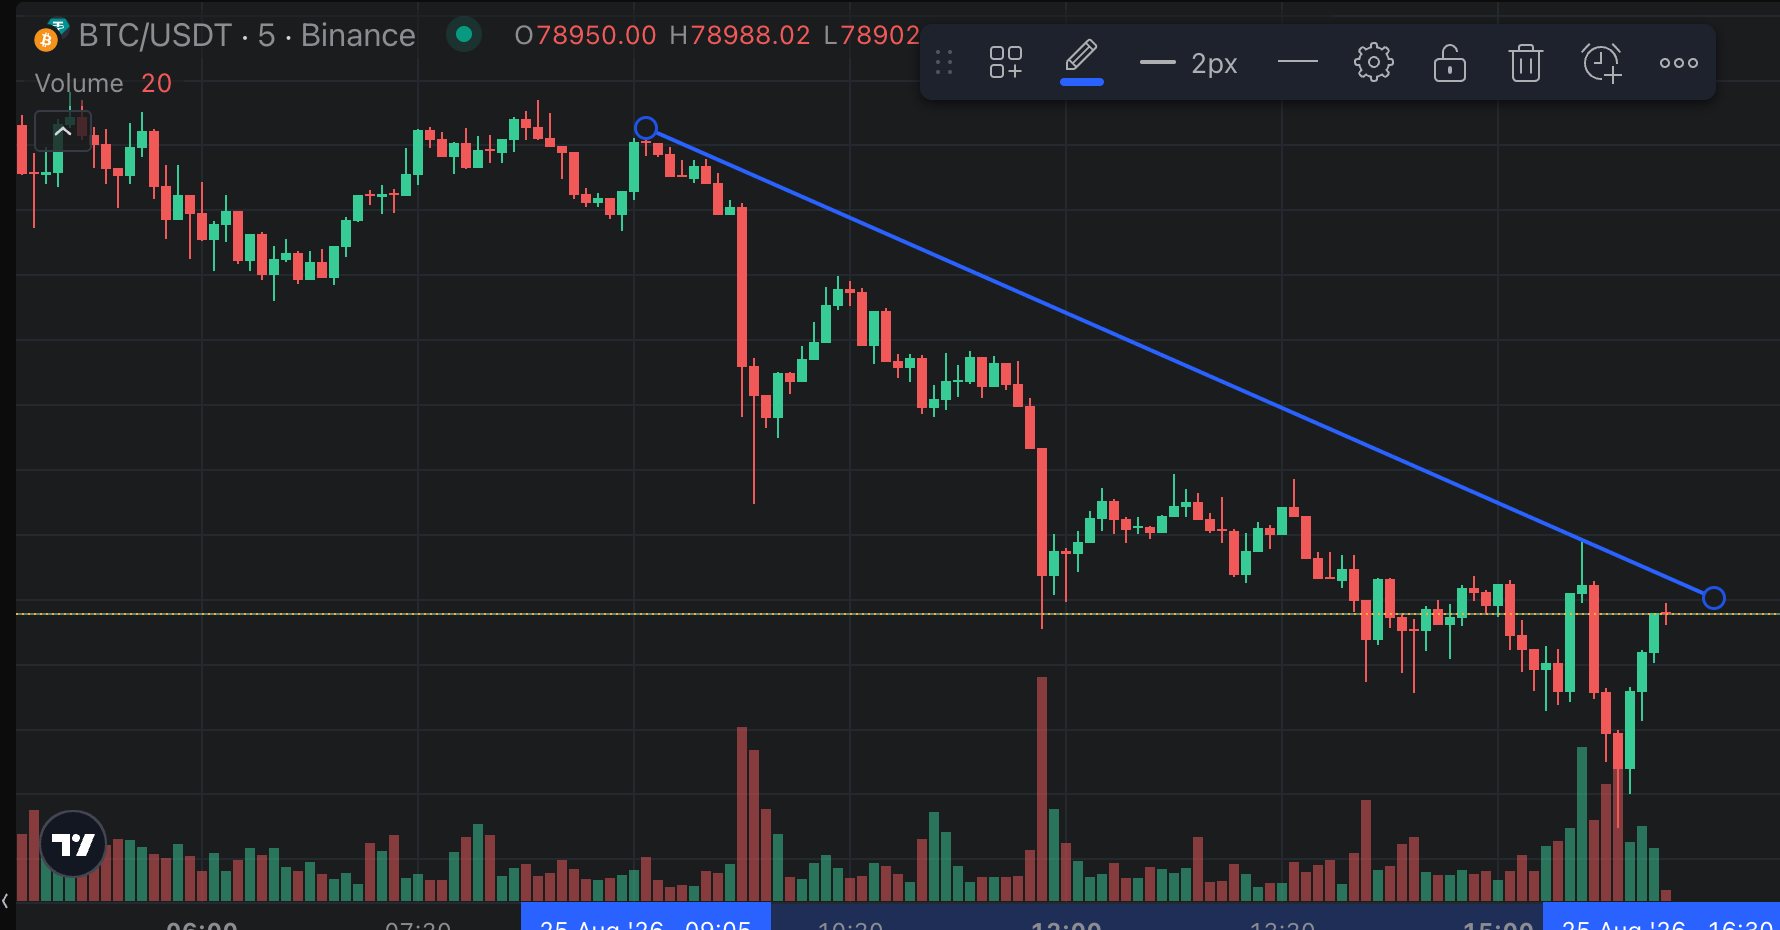
Open the market in the trading terminal and pick a drawing tool from the toolbar down the left edge of the chart, such as the trend line tool. Click and drag from your first point to your second to draw the line.
 🔍 Click the image to see a larger version
Draw a sloped line. If the line ends up flat, with both ends at the same price, Altrady creates an ordinary price alert instead and tells you so: Horizontal line detected, creating a price alert instead.
It is normal to need a second go. Endpoints snap to nearby candle highs and lows, so the line may not land exactly where you released the mouse. Drag an endpoint handle to adjust it, taking care to grab the handle itself: dragging next to it pans the chart instead.
Open the alert from the drawing toolbar
Click the line once to select it. A small floating toolbar appears above the chart with the drawing’s options: colour, line width, style, settings, lock, delete, and an alarm clock icon with a plus sign near the right-hand end.
 🔍 Click the image to see a larger version
Click that alarm clock icon. This is the only way to create a trend line alert, and it is easy to miss.
The Alerts tab in the right-hand column then opens on the Trend Line tab, with the line’s two points already filled in. Your drawing is replaced by an editable alert line in the same place, and you can drag its end points to adjust the alert before you save. If you cancel the form, that line disappears too and your original drawing is not restored.
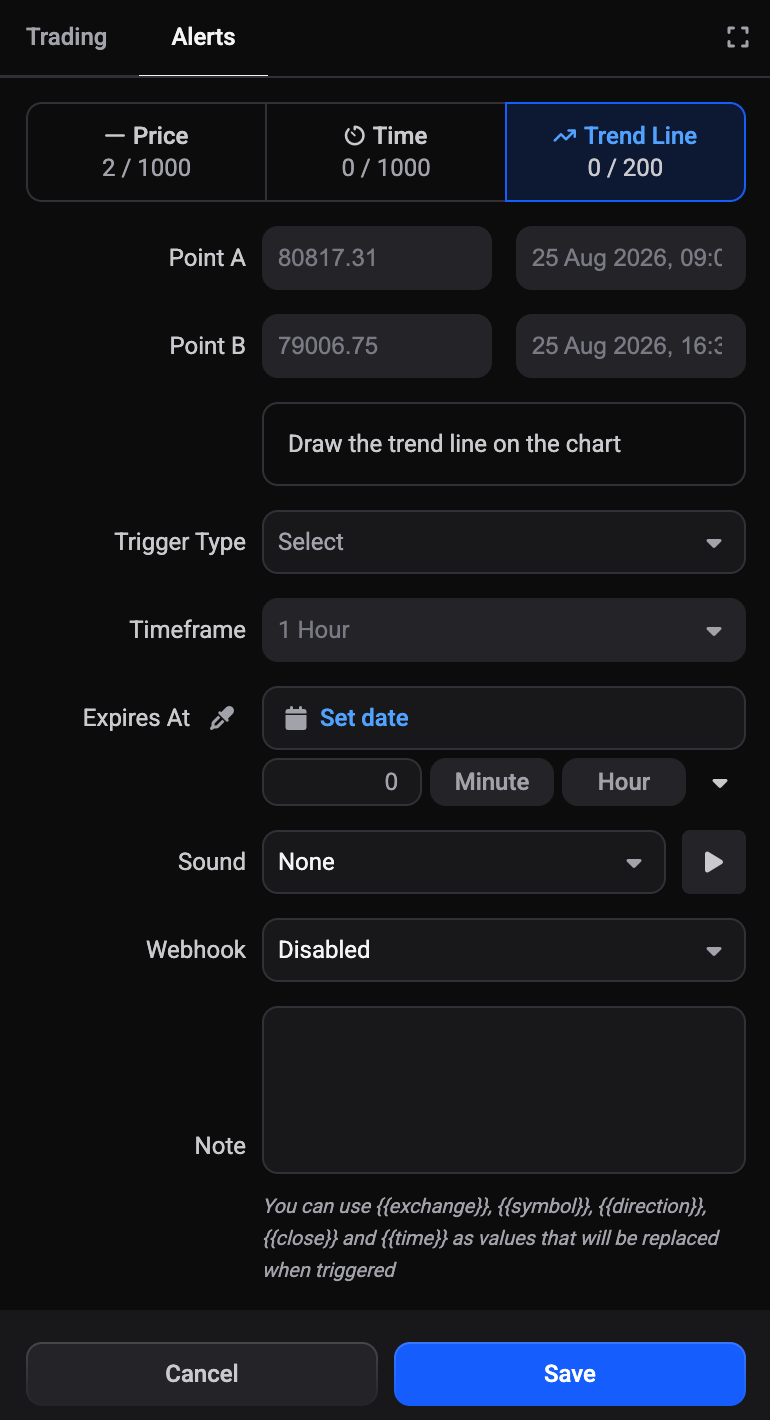
Check Point A and Point B
Point A and Point B show the price and the date and time of each end of your line. Altrady takes them from the drawing, so you do not type them in.
 🔍 Click the image to see a larger version
If you open the Trend Line tab directly without selecting a drawing first, Point A and Point B are empty and the tab tells you what to do: Draw a trend line on the chart, select it, then click the alarm clock icon in its toolbar to create the alert. Save stays greyed out until a drawing supplies the two points.
You do not set a direction. Altrady compares the line to the current price when you save and works out whether to watch for a rise through the line or a fall through it.
Choose a Trigger Type
Unlike the Price tab, Trigger Type starts empty on this tab, showing Select. You have to choose one before you can save:
- Once: fires the first time price crosses the line, then the alert is finished.
- Once on Bar Close: the condition is checked again when the bar closes, rather than the moment price touches the line.
- Once per Bar: can fire again on each new bar while the condition still holds.
- Once per Bar Close: can fire again at the close of each bar while the condition still holds.
The last three also need a Timeframe, which is the bar size the alert is measured against, not how often Altrady checks. It starts on whatever timeframe your chart is showing.
Add the optional details
The remaining fields work the same on every alert type:
- Expires At: an optional cut-off date, useful when a trend line stops being relevant. Pick a date with Set date, or use the number box with the Minute, Hour and Day buttons underneath for a quick offset. Leave it blank and the alert waits indefinitely.
- Sound: this follows the Custom alert sound from your notification settings. If you have not set one, no tone is selected, so the alert triggers silently unless you choose one here.
- Webhook: leave it Disabled, choose Altrady Signal Bot to feed the trigger into one of your signal bots, or External URL to post it to your own endpoint. See Send alerts to Discord or Telegram.
-
Note: your own reminder. It accepts placeholders that are filled in when the alert fires:
{{exchange}},{{symbol}},{{direction}},{{close}}and{{time}}.
Click Save when you are done.
Keep an eye on your limits and your plan
The count under the Trend Line tab label shows how many you have used against your maximum. Each market also has its own ceiling of 50 trend line alerts, counted separately from price and time alerts.
Trend Line Alerts are part of the Essential plan and above. If your plan does not include them, the tab shows Trend Line Alerts are not available on your plan. followed by You need to upgrade your account to Essential or higher, in order to use this alert type., with an Upgrade link that opens your account page in your browser.
Find it again afterwards
A saved trend line alert appears in the My Alerts tab at the bottom of the terminal, with Trend line in the Alert Type column. Use the Status toggle to move between Active for alerts still waiting, Alert History for alerts that have already fired, and Expired for alerts whose cut-off date passed first. You cannot change an alert’s type after saving. See Manage and troubleshoot alerts, and turn on delivery in your notification settings to hear about triggers while you are away.
Still stuck?
If the alarm clock icon does not appear on your drawing, or a saved trend line alert is not firing the way you expect, reach out through support chat in the app and the team will look at your chart with you.