
How do I use the Screener?
The Screener (called Market Explorer before version 6.0) is Altrady’s research and screening page. You use it to look at the whole market, filter it with your own rules, and turn a filter into a scanner that alerts you. It has six tabs: Overview, Screener, Maps, Sectors, Ranking and Scanners.
Open the Screener
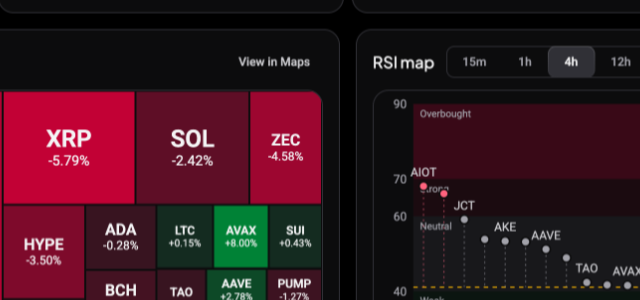 🔍 Click the image to see a larger version
Click Screener in the sidebar, just below Trading Terminal. The tabs sit along the top of the page, with a search box on the right where you can look up a coin or a pair. Click any coin anywhere in the Screener to open its coin page, which is covered in How do I use the Screener to research a coin?.
Next to the search box, the On your exchanges toggle shows only coins you can trade on the exchanges you have connected, with the ones each coin is on. Turn it off to see every coin Altrady tracks.
Everything here describes the market based on data. None of it tells you what to trade; what you do with a result is your decision.
Overview: the market at a glance
 🔍 Click the image to see a larger version
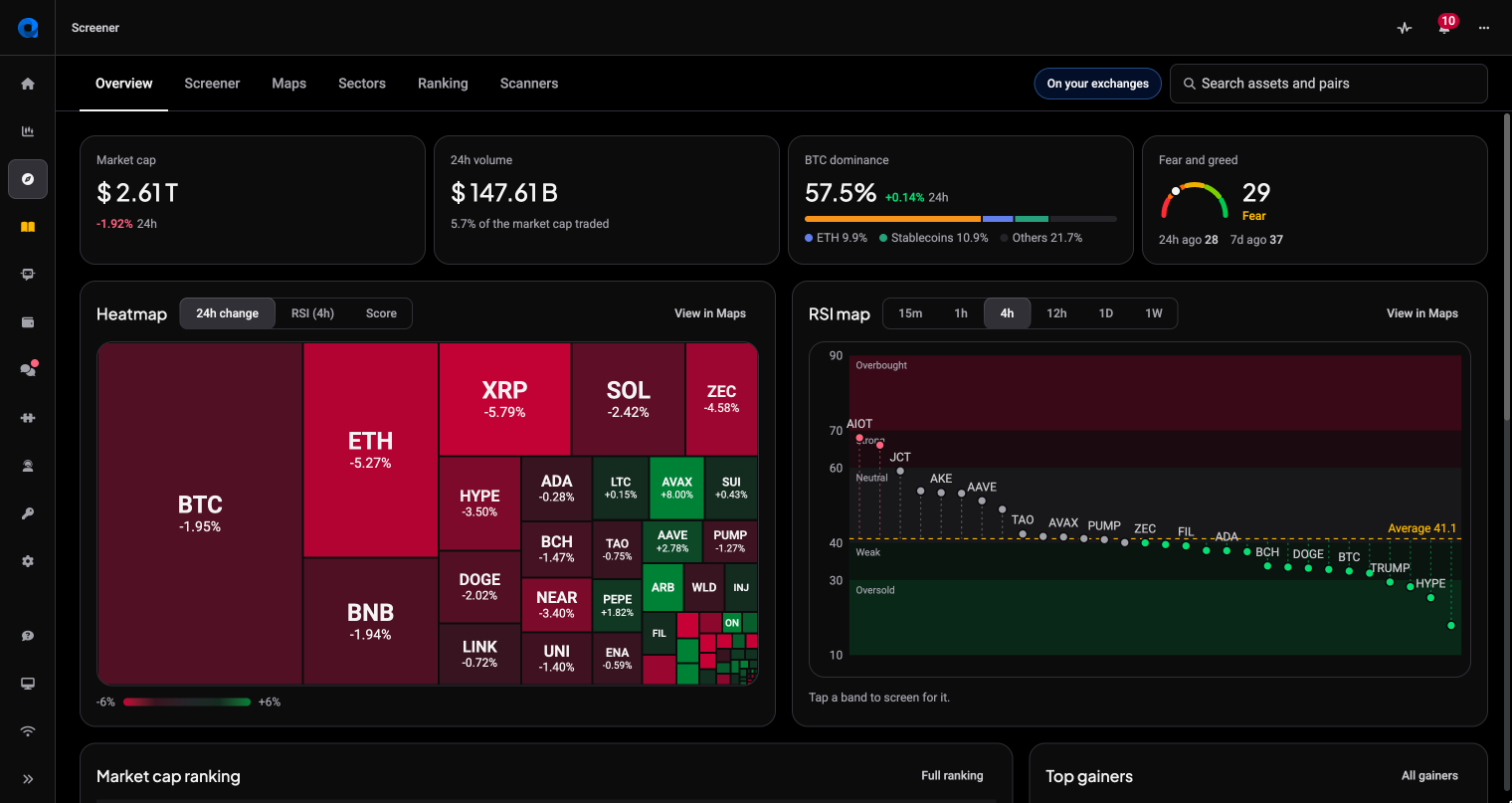
The Overview tab opens first. A strip at the top shows Market cap, 24h volume, BTC dominance and Fear and greed, explained in What do Dominance and Fear And Greed mean on the Screener overview?. Below it you find cards for the Heatmap, the RSI map, Top gainers, Top losers, Your scanners, Sector flow and Market cap ranking.
Each card has a link to its full page, such as View in Maps, All sectors, Full ranking or All scanners. The Start screening card opens Altrady’s own scanners so you can open one, change it and save your own.
Screener: filter the market with your own rules
 🔍 Click the image to see a larger version
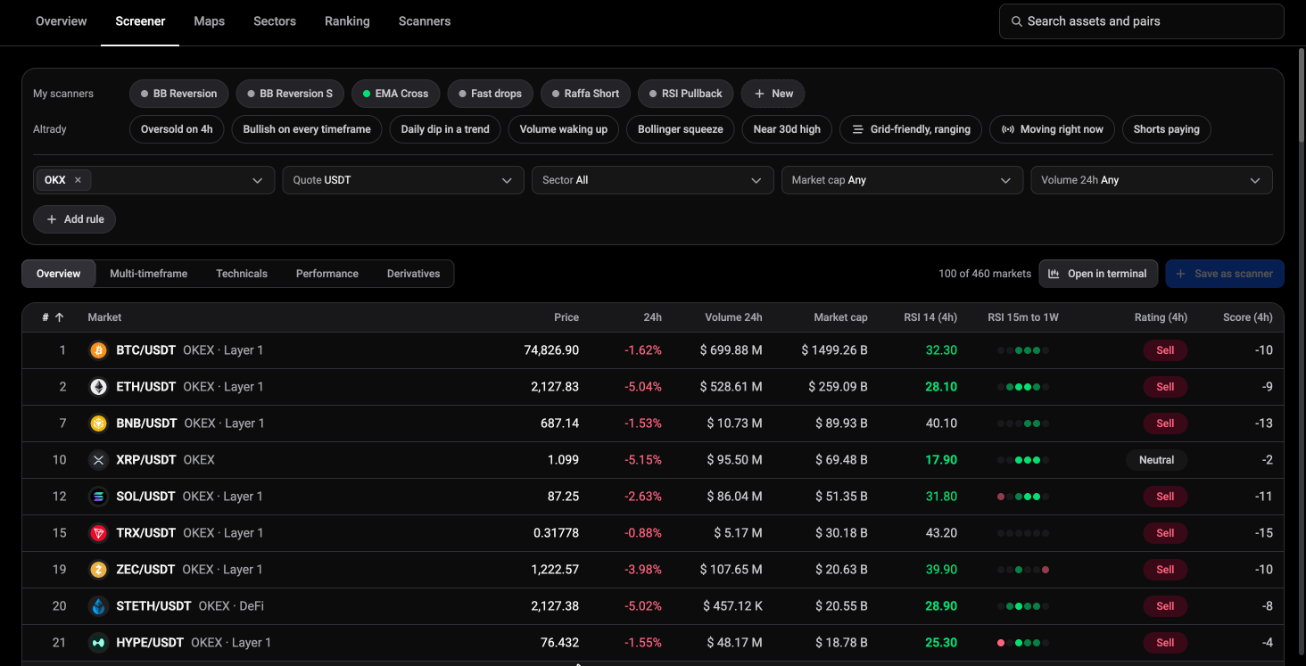
The Screener tab lists markets and lets you narrow them down:
- Pick where to start. My scanners lists the scanners you saved, and Altrady lists ready-made ones such as Oversold on 4h. Or press New to begin from scratch.
- Use the filters along the top: Exchanges, Quote, Sector, Market cap and Volume 24h.
- Press Add rule to add a condition, such as RSI 14 below a value on a timeframe. The line N of M markets shows how many markets match.
- Switch the column set to read the table the way you need: Overview, Multi-timeframe, Technicals, Performance or Derivatives.
Click a row to open a panel with the market’s details and shortcuts such as Open chart. Open in terminal opens the first market on the chart and keeps this list in the Scanner widget, so you can step through the rest.
When the rules look right, choose Start alerts to have a scanner tell you when a market starts matching, or Save as scanner to keep it without alerts. If you changed one of Altrady’s scanners, Save as new scanner keeps your version as your own.
Maps: see the market as a picture
 🔍 Click the image to see a larger version
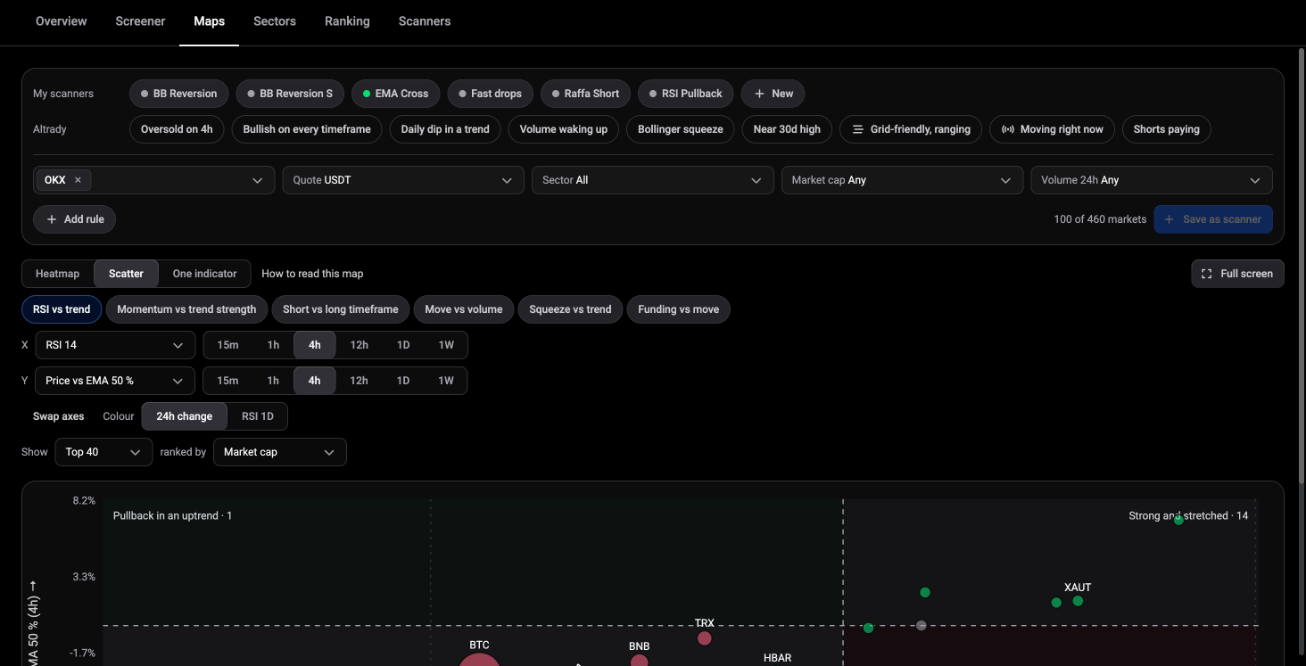
The Maps tab shows the markets that pass your filters in three ways: Heatmap, Scatter and One indicator. In the heatmap every tile is a coin, sized by market cap and coloured by the measure you pick under Colour by. In the scatter you pick two indicators, one for each axis, and the chart splits into four corners. In One indicator each dot sits at the value of a single field.
Click a zone, corner or side of the dashed line to screen for the coins in it, and click a dot to open the market. Full screen gives the map more room.
Sectors: how groups of coins are doing
 🔍 Click the image to see a larger version
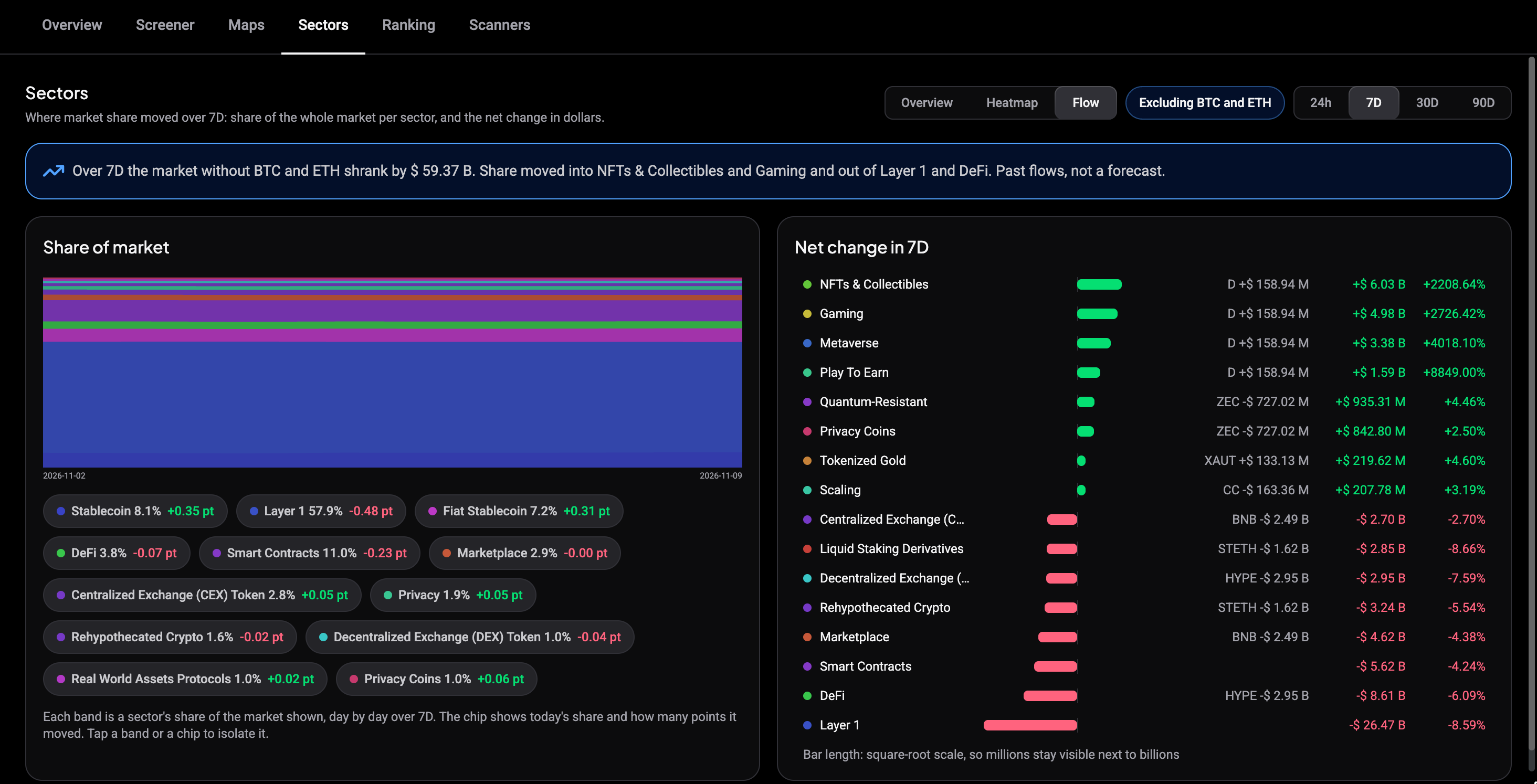
The Sectors tab groups coins by theme. It has three views: Overview (a table with market cap, share, change and dominance for each sector), Heatmap and Flow, which shows where market share moved. Choose a period of 24h, 7D, 30D or 90D, and turn on Excluding BTC and ETH to see the other coins without the two largest. Open a sector to see its coins against the sector’s own change, or use Open in Screener to screen them. This is past performance, not a forecast.
Ranking: market cap, gainers and losers
 🔍 Click the image to see a larger version
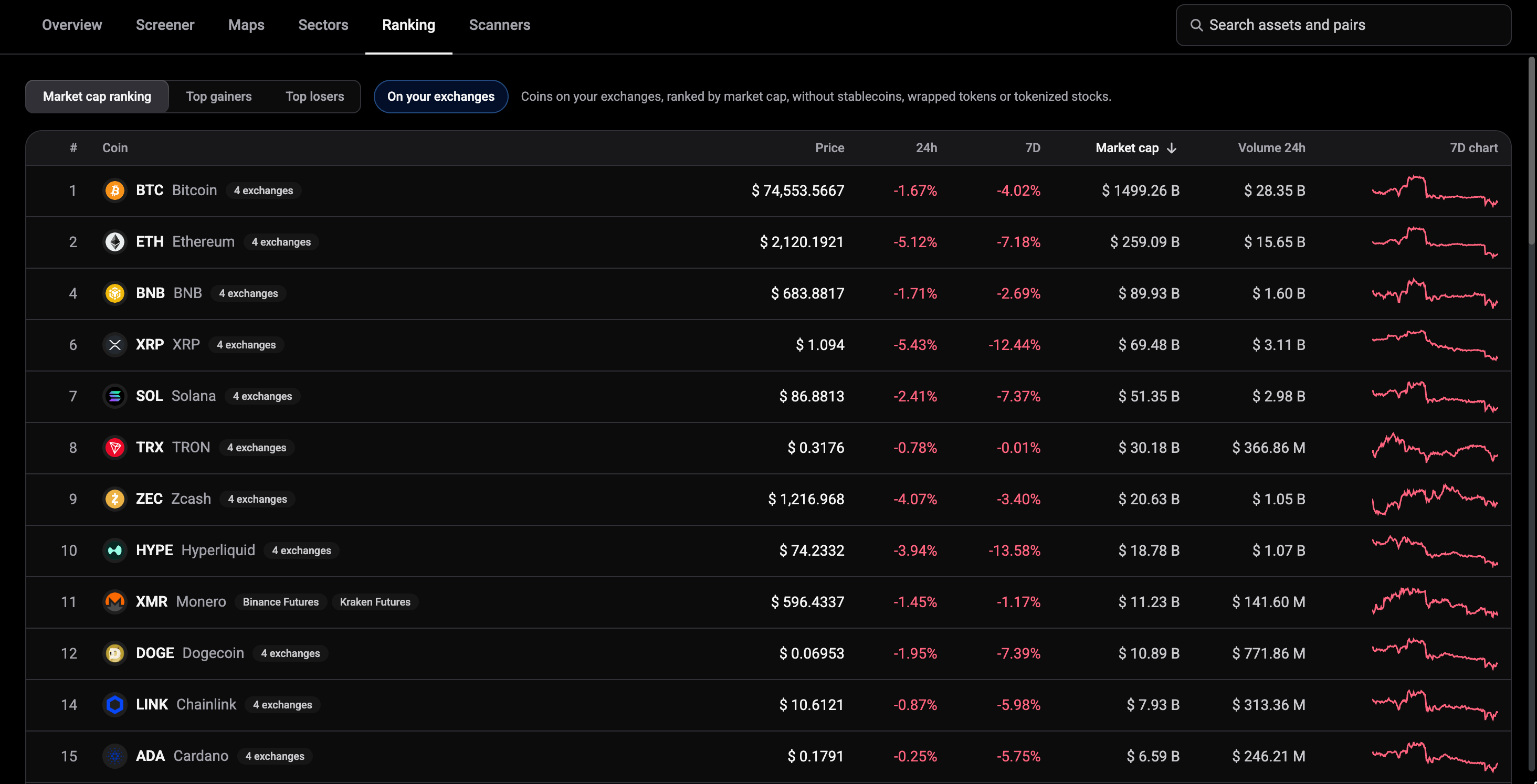
The Ranking tab has three views: Market cap ranking, Top gainers and Top losers. The market cap ranking leaves out stablecoins, wrapped tokens and tokenized stocks. Click a column header such as 24h, 7D, Market cap or Volume 24h to sort, and use the page controls at the bottom to show 25, 50 or 100 rows. Top gainers and Top losers only include coins trading more than $1M a day, so thinly traded coins don’t fill the list. For a walkthrough see How do I find top gainers, losers, and market cap rankings?.
Scanners: your alerts on one page
 🔍 Click the image to see a larger version
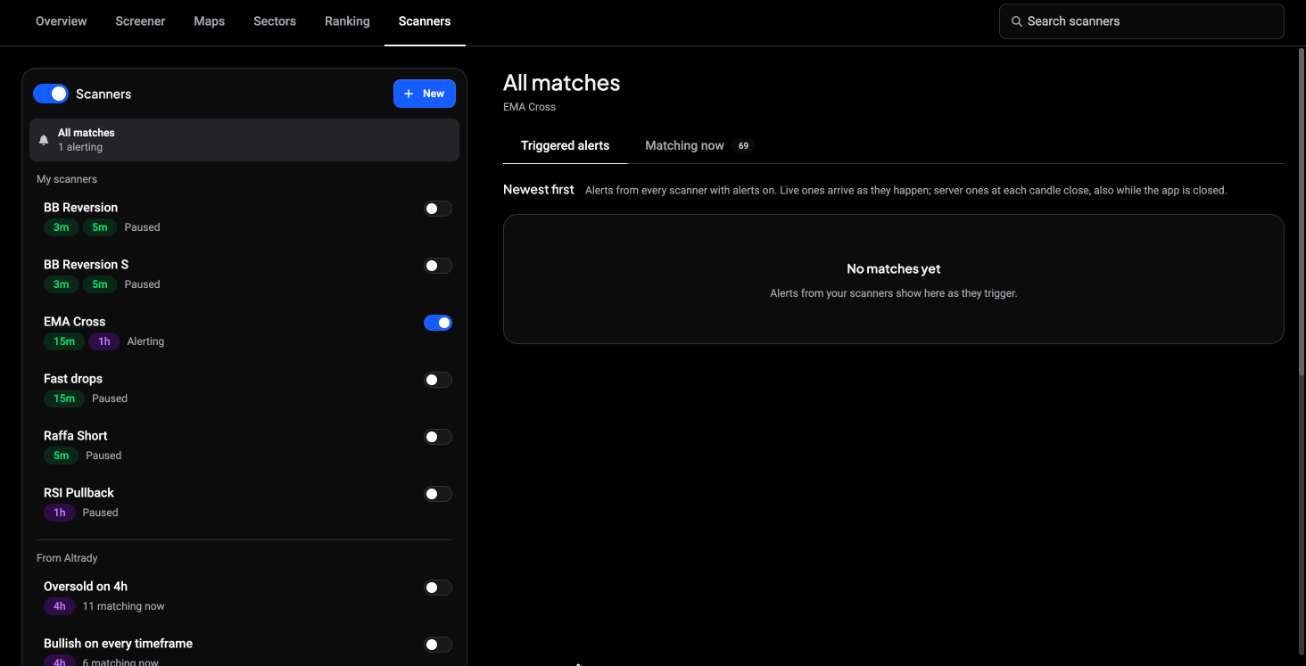
The Scanners tab is the full-page view of the scanners you also see in the Scanner widget. My scanners lists the ones you built and From Altrady lists the ready-made ones. Each shows whether it is alerting, paused or has alerts off, how many markets match now, and where it runs: In the app or On our servers. Use Search scanners to find one, New to create one and Start alerts to switch one on. The Triggered alerts list shows every new match, newest first, and Matching now shows what matches at this moment. To learn how scanners are built, see How do I create a scanner?.
Still stuck?
If a tab won’t load or a number looks off, reach out through support chat in the app and our team will take a look.