
What do Dominance and Fear And Greed mean on the Market Explorer overview?
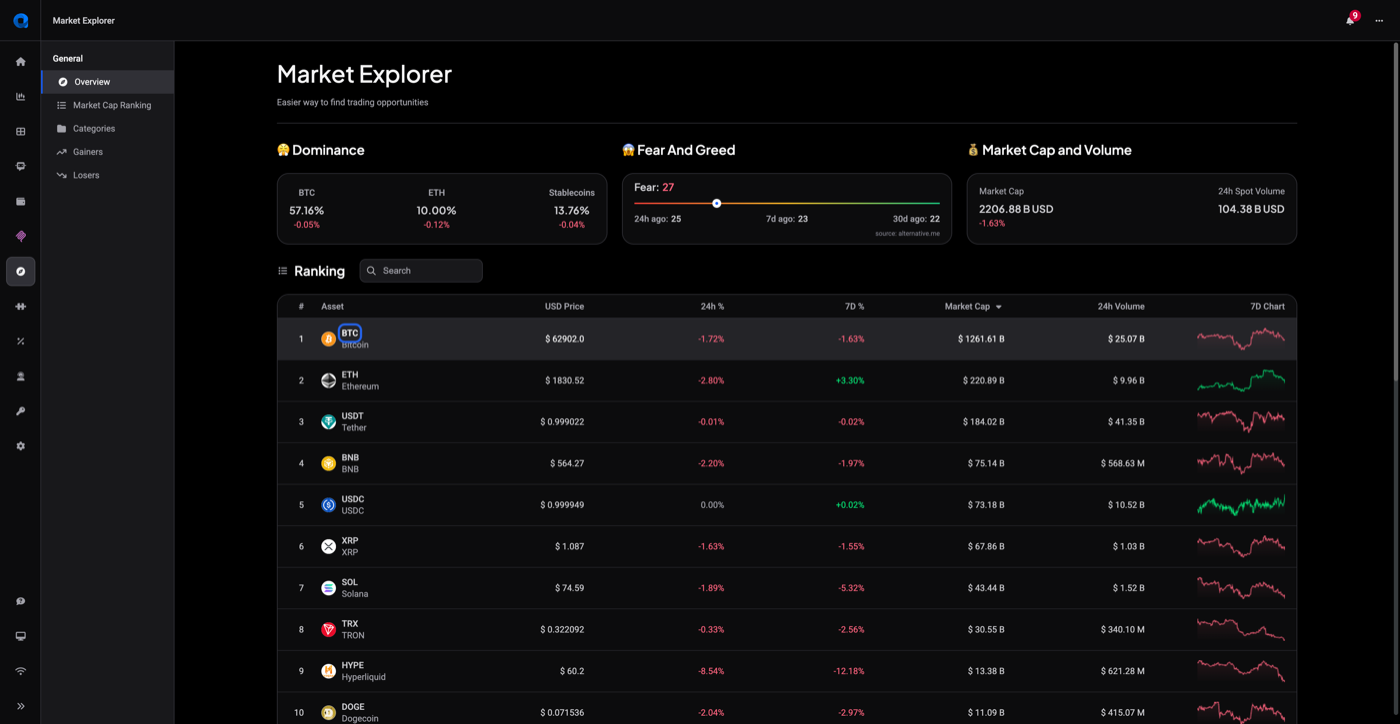
On the Market Explorer Overview page, two cards sit at the top of the page: Dominance shows how much of the total crypto market cap sits in BTC, ETH and stablecoins, and Fear And Greed shows a 0-100 sentiment score for the market today. Both are context you read alongside your own analysis, not signals to act on.
Where to find them
Open Market Explorer from the main menu. The sidebar, under the General heading, lists five views: Overview, Market Cap Ranking, Categories, Gainers and Losers. Overview is the first one, and it opens on the market-wide snapshot.
Three cards sit side by side in a row across the top of that page: Dominance, Fear And Greed and Market Cap and Volume. The Ranking table with all tracked coins fills the rest of the page underneath them. On a narrow window the three cards stack on top of each other instead, which is normal.
 🔍 Click the image to see a larger version
Reading the Dominance card
Dominance measures a coin’s share of the entire crypto market’s capitalization, as a percentage. The card shows three figures side by side:
- BTC: Bitcoin’s share of total market cap
- ETH: Ethereum’s share of total market cap
- Stablecoins: the combined share held by stablecoins
Under each percentage sits its 24-hour change, in green when it rose and in red when it fell, with a plus or minus sign.
In plain terms: when BTC dominance rises, market cap is concentrating into Bitcoin relative to everything else. When it falls, the rest of the market is holding a larger share. A rising stablecoin share means more of the total market cap is parked in stablecoins rather than in other assets. These figures describe where market cap sits right now, they say nothing about what happens next.
Reading the Fear And Greed card
The card shows today’s classification and value together, for example “Fear: 34”, followed by a slider running from red through yellow to green so you can see at a glance where today’s reading lands between 0 and 100. Low values sit at the red end, high values at the green end.
Underneath the slider are three past readings for comparison:
- 24h ago
- 7d ago
- 30d ago
Comparing today’s number against those three tells you whether sentiment has been drifting one way over the past month, instead of leaving you with a single snapshot. If one of them shows “na”, Altrady simply has no reading stored for that day.
The bottom of the card carries a source line: the index is published by alternative.me, a third party that combines volatility, momentum, social activity and other market data into one number. Altrady displays it, it does not calculate it.
How the index is normally read
This is how the alternative.me index is commonly interpreted across the industry, not an Altrady rule:
- Readings toward the red end are labelled “Extreme Fear” or “Fear” and describe a market where caution or selling pressure is dominant.
- Readings toward the green end are labelled “Greed” or “Extreme Greed” and describe a market leaning toward optimism and buying.
- Readings around the middle are closer to neutral.
What these cards do not do
Both cards describe the state of the market. They do not tell you what to buy, sell or hold, and nothing in Altrady acts on them automatically: no bot, scanner or alert reads Dominance or Fear And Greed. Whether either number changes anything about your position sizing or your risk rules is entirely your decision.
You will also see the same two metrics on the Altrady dashboard, in the Markets panel under the Explore toggle, if you want them next to your positions rather than on a page of their own.
Where to go next
If a reading makes you curious about one coin in particular, click its row in the Ranking table below the cards to open that coin’s own page with price history, technical analysis and news. That page is walked through in How do I use Market Explorer to research a coin?.
To scan the wider market first, the ranked lists are covered in How do I find top gainers, losers, and market cap rankings?.
Still stuck?
If the Dominance or Fear And Greed card is not loading, or a value looks stuck, reach out through support chat in the app and our team will take a look.