
How do I create a TA Scanner strategy?
A TA Scanner strategy is a set of rules that watches the markets you choose and fires an alert when your conditions line up. You build it from the TA Scanner widget, then switch it on.
Accessing the TA Scanner
The TA Scanner is a widget in the Trading Terminal layout. If you don’t see it in your terminal, see What is the TA Scanner and how does it work? for how to add it.
The scanner dropdown
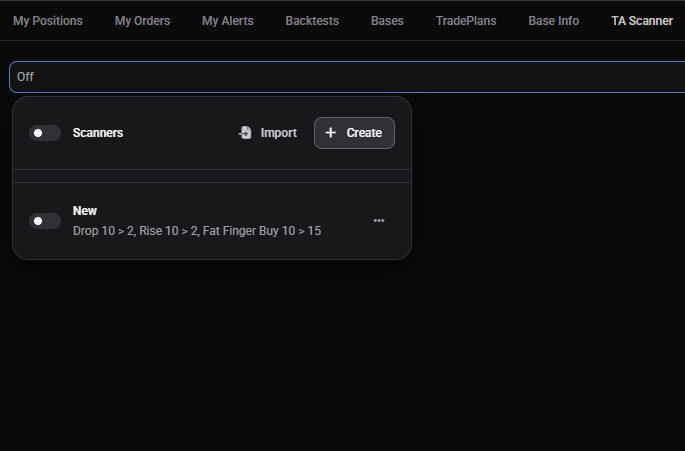
At the top of the TA Scanner widget there is a dropdown control. When no scanners are running it shows Off. Once you enable one or more scanners it updates to show their names and count.
Click the dropdown to open the scanners panel. Inside you’ll find:
- Scanners list: every scanner you’ve built or imported, each with its own on/off toggle.
- Import: load a scanner from a shared link or exported file. Imported scanners start disabled so nothing fires until you review them.
- + Create: open the Builder to set up a new scanner from scratch or from a template.
 🔍 Click the image to see a larger version
To edit, duplicate, share, or delete an existing scanner, click the three-dot menu next to its name.
🔍 Click the image to see a larger version
To edit, duplicate, share, or delete an existing scanner, click the three-dot menu next to its name.
Start from a template or from scratch
 🔍 Click the image to see a larger version
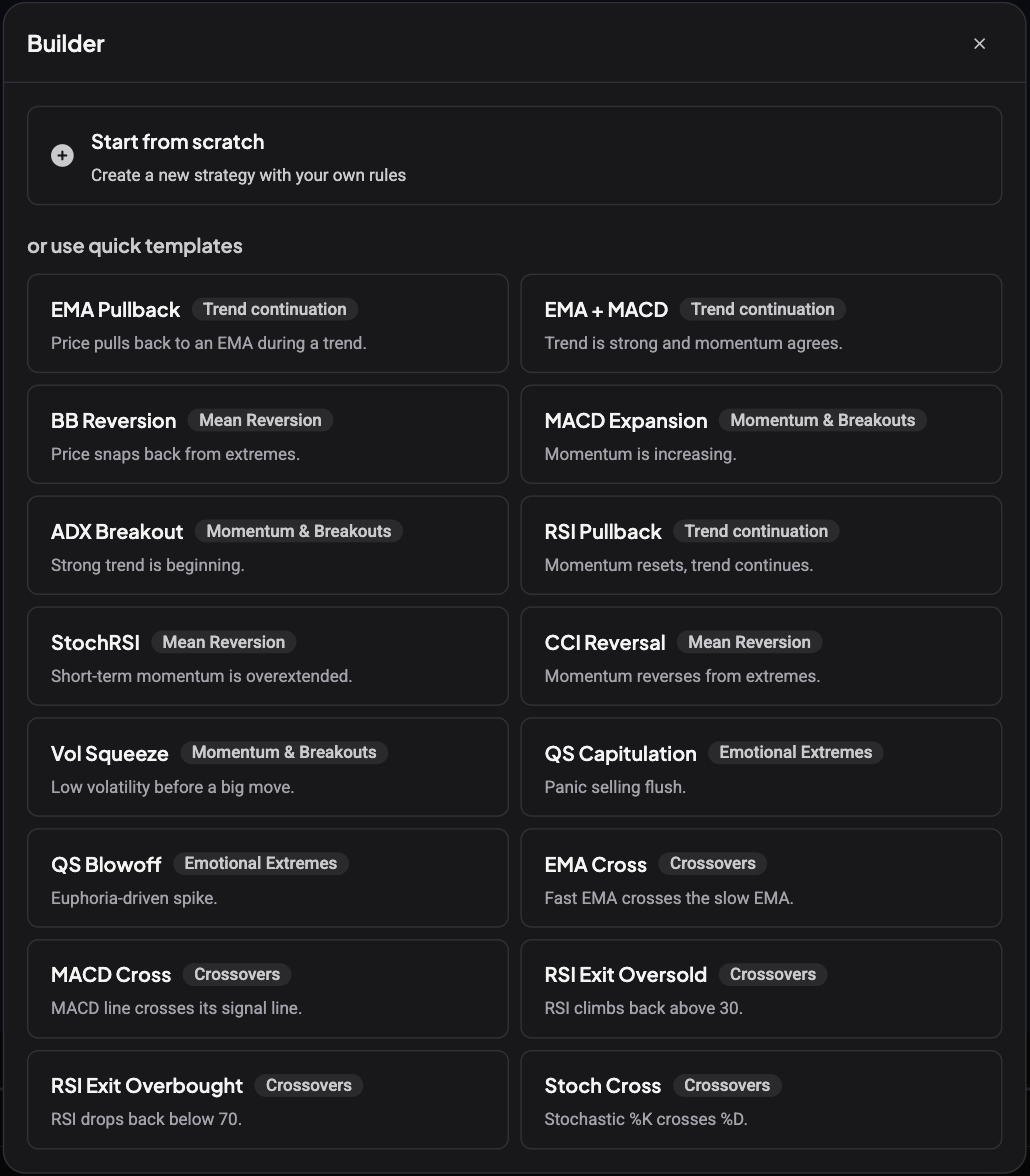
Clicking + Create opens the Builder. You can choose Start from scratch to build your own strategy with an empty rule, or pick one of the quick templates to pre-fill a working configuration you can adjust.
The templates are grouped by theme:
- Trend continuation: EMA Pullback, EMA + MACD, RSI Pullback.
- Mean Reversion: BB Reversion, StochRSI, CCI Reversal.
- Momentum & Breakouts: MACD Expansion, ADX Breakout, Vol Squeeze.
- Emotional Extremes: QS Capitulation, QS Blowoff.
- Crossovers: EMA Cross, MACD Cross, RSI Exit Oversold, RSI Exit Overbought, Stoch Cross. These use the crossover operators described below and start with Trigger on set to Close.
Templates are preset configurations built from common indicator combinations, not a suggestion to trade any particular way. Give the strategy a name at the top of the builder so you can recognize it later in the scanners list.
 🔍 Click the image to see a larger version
Creating a custom strategy
Whether you started from scratch or from a template, the strategy editor has the same layout:
- Enter a strategy name at the top.
- Choose when the strategy is evaluated with Trigger on: Tick or Close.
- Configure Filters to control which markets are scanned.
- Add one or more Rules with conditions that define when an alert fires.
- Click Save.
 🔍 Click the image to see a larger version
Trigger on sits to the right of the name field. Tick checks your rules on every price update, so an alert can fire while the current candle is still forming. Close waits for the candle to finish and checks the completed values once. Close gives fewer, more settled alerts; Tick reacts sooner. Strategies made before this control existed run on Tick. Crossover templates start on Close because a crossover compares the current bar with the previous one.
The sections below walk through each part.
Global filters
The Filters section sits above Rules and applies to every rule inside the strategy. It controls which markets the scanner watches.
Always visible:
- Exchanges: multi-select dropdown to choose which exchanges to scan. The number you can select depends on your plan.
- Quote currencies: available options depend on the selected exchanges. Common quote currencies (USDT, USDC, BTC) are prioritized. Also limited by plan.
- Timeframes: the resolutions of candle data the scanner evaluates, such as 15 minutes or 1 hour. Available timeframes depend on your plan.
Optional filters, added from the Change filters dropdown at the right of the Filters heading:
- Volume USD: filter markets by 24h volume. Presets: 0, 1K, 10K, 100K, 1M, 10M.
-
Blacklist: comma-separated coins to exclude, for example
DOGE, SHIB. Each entry must be the full coin name:OILexcludes the coin OIL only, not UKOIL or USOIL. Partial names and wildcards aren’t supported here, so list every coin you want to exclude. Capitals don’t matter. This is different from the signal bot blacklist, which also matches part of a name, see Signal bot whitelists and blacklists. - Whitelist: comma-separated coins to include, matched on the full coin name in the same way. Mutually exclusive with the blacklist: you can use one or the other, not both.
- Flat Candles: filter out low-activity markets with consecutive flat candles (Essential and Premium plans only).
 🔍 Click the image to see a larger version
Building rules and conditions
Each strategy can have multiple rules, shown as tabs in the rule editor alongside an + Add Rule button. Each rule defines a set of conditions that must all line up for an alert to fire.
Rule settings
Every rule has a few settings at the top:
- Name: displayed as a colored badge in scanner results so you can tell which rule matched.
- Color: choose from 8 preset colors (red, orange, yellow, green, dark green, blue, dark blue, purple). The badge in the results list uses this color.
- Alert Sound: pick a sound from the dropdown, or choose No sound if you’d rather rely on push notifications alone.
- Push Notification: turn on or off for that rule.
Both alert settings are per rule, so different rules in the same strategy can notify you differently.
Adding conditions
Each condition consists of three parts:
- Source indicator: select from a categorized dropdown (with search), for example an EMA, RSI, or price field.
- Operator: choose a comparison operator (see the table below).
- Target: either a numeric value or another indicator.
Click Condition to add another line. Each new condition attaches with AND or OR, so you can chain as many as you need.
Don’t worry about getting every condition perfect on the first pass. You can edit, reorder, or remove any condition before saving.
Timeframe and bars ago per indicator
 🔍 Click the image to see a larger version
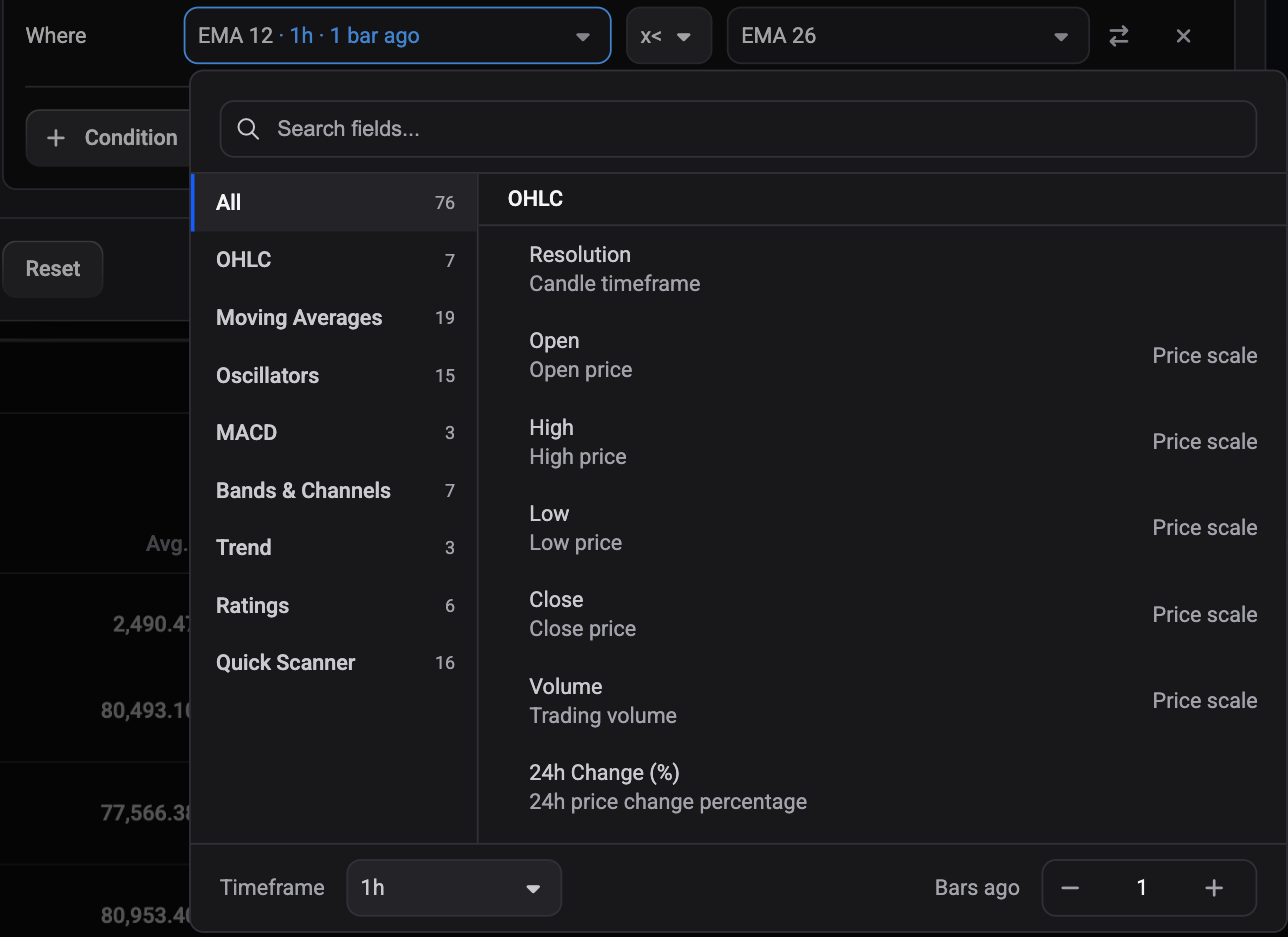
By default every indicator is calculated on the timeframes you picked in Filters and uses the most recent candle. You can change both for one indicator at a time. Click the indicator in a condition to open its popup and look at the footer:
- Timeframe: Strategy follows the Filters timeframes. Pick a specific timeframe (1m up to 1d) to calculate this indicator on that timeframe instead, for example a 1h EMA inside a 15m strategy.
- Bars ago: 0 uses the current candle. Set 1 to 20 to read the value that many completed candles back.
 🔍 Click the image to see a larger version
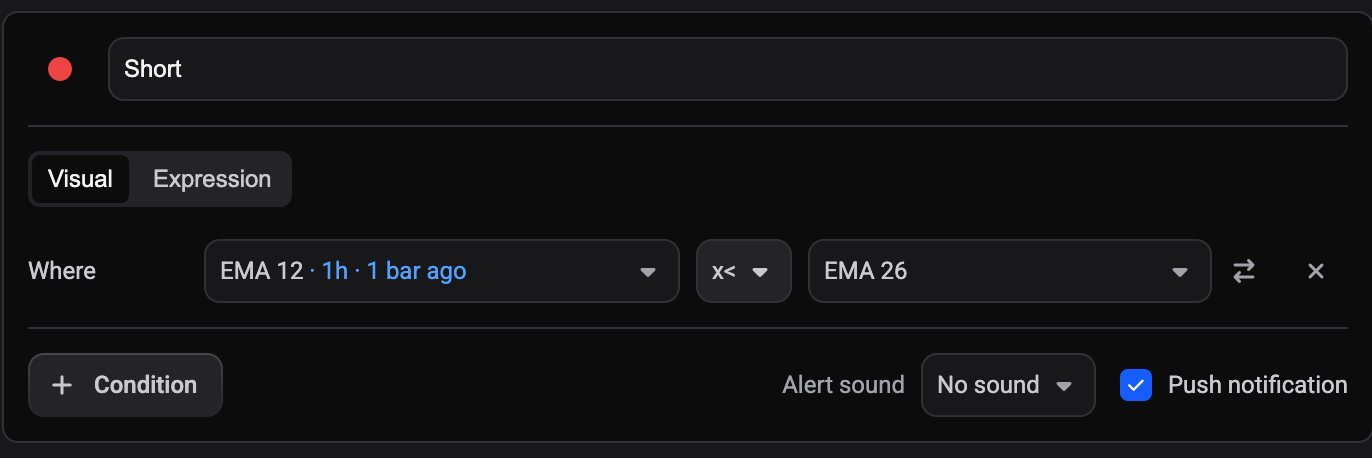
The indicator chip shows the override next to its name, for example EMA 12 · 1h · 1 bar ago, and reads plainly when nothing is overridden. Source and target indicators each carry their own override, so close on the strategy timeframe can be compared with ema200 on 4h. Market and metadata fields such as Volume USD, exchange or quote do not take an override.
Operators
| Operator | Meaning | Example |
|---|---|---|
< |
Less than |
RSI14 < 30: RSI is below 30 |
<= |
Less than or equal to |
close <= EMA9: price touched or crossed below EMA |
> |
Greater than |
ADX14 > 25: trend strength above threshold |
>= |
Greater than or equal to |
high >= BB Upper: candle wick reached upper band |
== |
Equal to |
MACD Hist == 0: histogram at zero line crossover |
!= |
Not equal to |
volume != 0: market has trading activity |
x> |
Crosses above |
ema12 x> ema26: fast EMA was at or below the slow EMA on the previous bar and is above it now |
x< |
Crosses below |
rsi14 x< 70: RSI was at or above 70 on the previous bar and is below it now |
Because indicator values are continuously changing decimal numbers, exact equality matches (== and !=) are rare in practice. These operators work best for discrete values like checking whether a signal is 0 or non-zero. For most conditions, use <, >, <=, or >= with threshold values.
Crossover operators
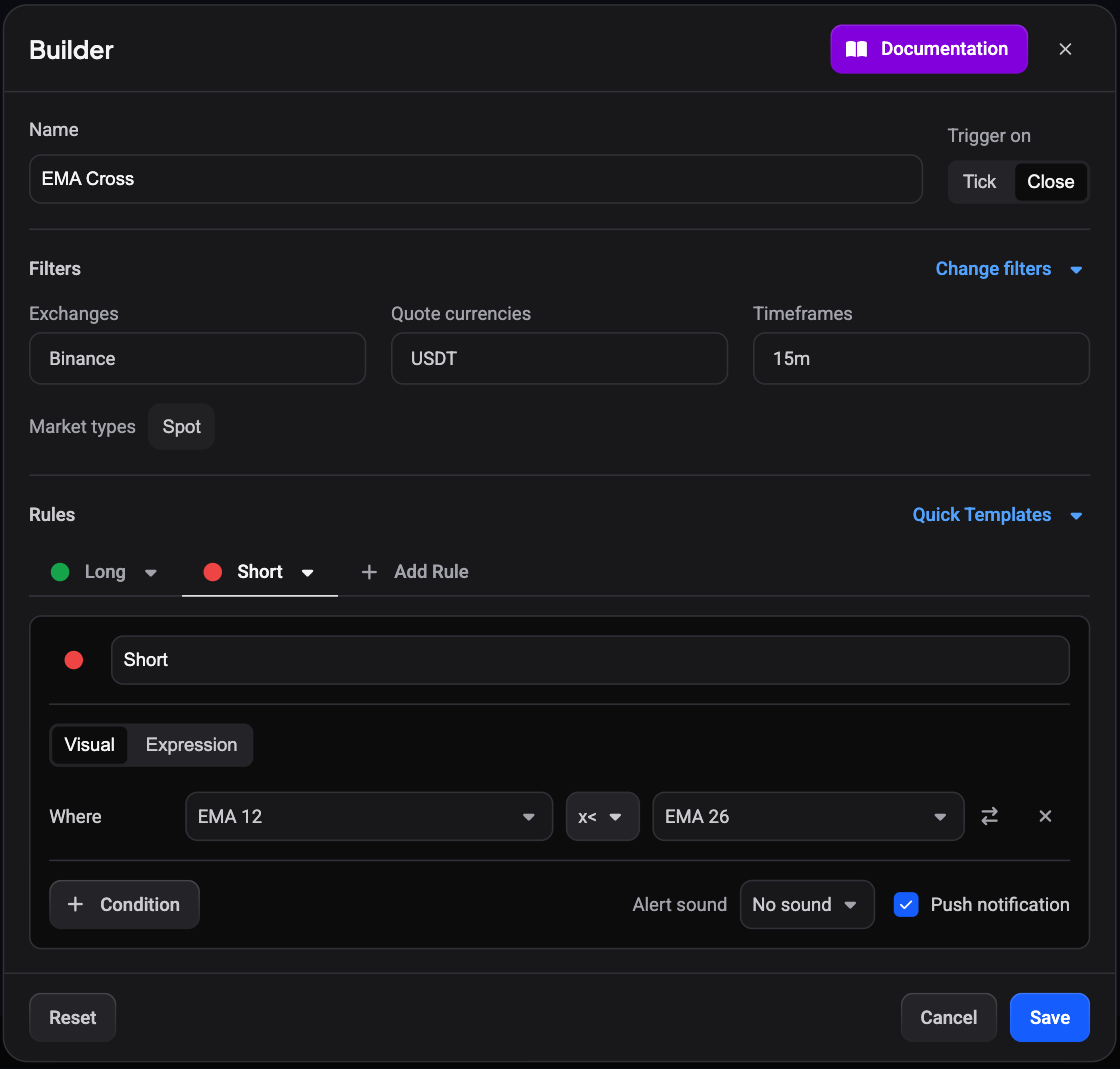 🔍 Click the image to see a larger version
x> and x< fire once, on the bar where the left side moves across the right side, instead of every bar it stays on one side. They compare the current bar with the previous one, so they work with Trigger on set to Close and appear in the operator dropdown only for numeric indicators. The right side can be another indicator or a fixed value. With a crossover, Bars ago on either side can be at most 19, because the scanner needs one more bar of history to look back from.
Each crossover counts as 2 conditions towards the conditions per rule limit on your plan. Keep this in mind when you combine crossovers with other conditions in the same rule.
AND/OR logic
Conditions within a rule are chained with AND or OR operators. Each condition after the first has a logic selector to choose between them.
- AND means all conditions must be true at the same time. This narrows results: for example, an alert triggers only when the RSI is low and the price is below the Bollinger Band.
- OR means at least one condition must be true. This widens coverage: an alert triggers when either setup appears.
Conditions are evaluated left to right in sequence. For example, RSI14 < 30 AND close < BB Lower OR volume > SMA20 is evaluated as ((RSI14 < 30) AND (close < BB Lower)) OR (volume > SMA20).
If you need more complex grouping you have two options: use the Expression Editor (see below), which supports parentheses, or split your logic across multiple rules within the same strategy. Each rule is evaluated independently, so separate rules can represent distinct condition groups.
Expression editor
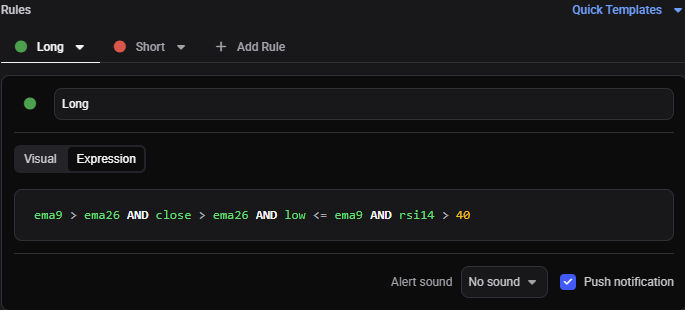 🔍 Click the image to see a larger version
For more control over condition logic, each rule has a Visual / Expression toggle at the top. The Expression Editor lets you write conditions as free-form text instead of using the visual condition rows.
🔍 Click the image to see a larger version
For more control over condition logic, each rule has a Visual / Expression toggle at the top. The Expression Editor lets you write conditions as free-form text instead of using the visual condition rows.
Switching modes
Click Expression to switch from visual mode to expression mode. Your existing visual conditions are automatically converted to an expression string. Click Visual to switch back. If the expression can be represented as flat conditions (no parentheses grouping), it converts back without issue. If it uses parentheses, the Visual button is disabled; you’ll need to simplify the expression first or keep using expression mode.
Expression syntax
An expression is one or more conditions joined by AND or OR:
rsi14 < 30 AND close < bb20_lower
Parentheses allow explicit grouping, giving you full control over evaluation order:
(rsi14 < 30 AND close < bb20_lower) OR (stochk < 20 AND stochd < 20)
Without parentheses, conditions are evaluated left to right. With parentheses, the grouped conditions are evaluated first. This is the key advantage of the expression editor over the visual mode.
| Syntax | Example | Description |
|---|---|---|
indicator operator value |
rsi14 < 30 |
Compare an indicator to a numeric value |
indicator operator indicator |
close > ema26 |
Compare two indicators |
AND / OR
|
rsi14 < 30 AND close < bb20_lower |
Logical operators to chain conditions |
( ... ) |
(rsi14 < 30 OR stochk < 20) AND close < bb20_lower |
Parentheses for grouping |
indicator@timeframe |
ema200@240 > close |
Calculate the indicator on another timeframe |
indicator[n] |
rsi14[1] < 30 |
Read the value n completed candles back (1 to 20) |
indicator@timeframe[n] |
rsi14@60[2] > 50 |
Both: 1h RSI from two bars ago |
x> / x<
|
ema12 x> ema26 |
Crossover operators, see the table above |
![The rule editor in Expression mode showing the formula ema12@60[1] x< ema26, where @60 is the 1 hour timeframe and [1] means one bar ago](/rails/active_storage/blobs/redirect/eyJfcmFpbHMiOnsiZGF0YSI6MTU0MTIsInB1ciI6ImJsb2JfaWQifX0=--2ce128a61cb2d00947c60172f9551ffd6adefaa9/expression-ref-syntax.png) 🔍 Click the image to see a larger version
🔍 Click the image to see a larger version
Timeframe codes are the candle length in minutes: 1, 2, 3, 5, 10, 15, 30, 60 (1h), 240 (4h), plus D for 1 day. Type @ after an indicator and the autocomplete lists them. A bare indicator name means the strategy timeframe and the current candle, exactly like the visual editor’s defaults. Switching to Visual keeps every @ and [n] as the indicator’s Timeframe and Bars ago override.
Autocomplete
As you type in the expression editor, an autocomplete popup suggests available options:
-
Indicators: all available indicator IDs (for example
rsi14,ema26,bb20_upper), shown with their category and description. - Operators: valid comparison operators for the current source indicator.
-
Logical operators:
ANDandORafter a complete condition.
Start typing an indicator name and select from the suggestions, or type the full indicator ID manually.
Validation
The expression editor validates your input in real time and highlights errors such as unknown indicator names, invalid operators for a given indicator, values outside the allowed range (for example RSI must be 0 to 100), incompatible indicator comparisons, missing closing parentheses, and incomplete conditions.
Examples
Simple momentum scan:
rsi14 < 30 AND stochk < 20
Grouped conditions, where an alert fires when either momentum setup triggers while price is below the moving average:
(rsi14 < 30 OR stochk < 20) AND close < sma50
Complex multi-signal scan with trend confirmation:
(close > ema26 AND macd_line > macd_signal) AND (rsi14 > 50 OR mom10 > 0)
Using ratings for a high-level trend filter:
trend == 2 AND rsi14 < 70
Higher timeframe trend with a lower timeframe trigger, on a 15m strategy:
close@240 > ema200@240 AND rsi14 x> 30
RSI rising over the last three completed candles:
rsi14 > rsi14[1] AND rsi14[1] > rsi14[2]
The Quick Templates dropdown, at the right of the Rules heading, lets you drop a template’s values in at any point.
Enable the strategy
A strategy does nothing until you turn it on. In the scanners panel (opened from the dropdown), each scanner has its own enabled/disabled toggle. Flip it on, and the dropdown label updates to reflect it. Enable as many scanners as you want running at once; disable the ones you’re not using to keep your alert feed focused.
Keep in mind that alerts can take anywhere from a few minutes to several hours to arrive, depending on the timeframe you picked and current market conditions. A 15-minute rule on a quiet market can sit quietly for a while before a candle matches, and that’s normal.
Still stuck?
If your strategy is enabled but you’re not seeing the alerts you expect, reach out through support chat in the app. Have your strategy name, the timeframe you set, and an example of the condition you expected to trigger ready, it helps us check things faster.