
How do I use Market Explorer to research a coin?
Market Explorer is Altrady’s built-in research view for any coin: price, exchange listings, news, and technical readouts in one place, no separate site needed. Open it from the main sidebar, then drill into a single coin’s page to see everything Altrady knows about it.
Open Market Explorer
Click Market Explorer in the main navigation. A left-hand menu gives you five views:
- Overview: a market-wide snapshot (dominance, Fear and Greed, market cap and volume).
- Market Cap Ranking: coins ranked by market capitalization.
- Categories: coins grouped by sector (DeFi, gaming, and so on).
- Gainers: top movers up over the last 24 hours.
- Losers: top movers down over the last 24 hours.
Pick any of these to browse the market broadly. To research one specific coin in depth, click that coin’s row from any of these lists, this opens its dedicated coin page.
The coin page layout
 🔍 Click the image to see a larger version
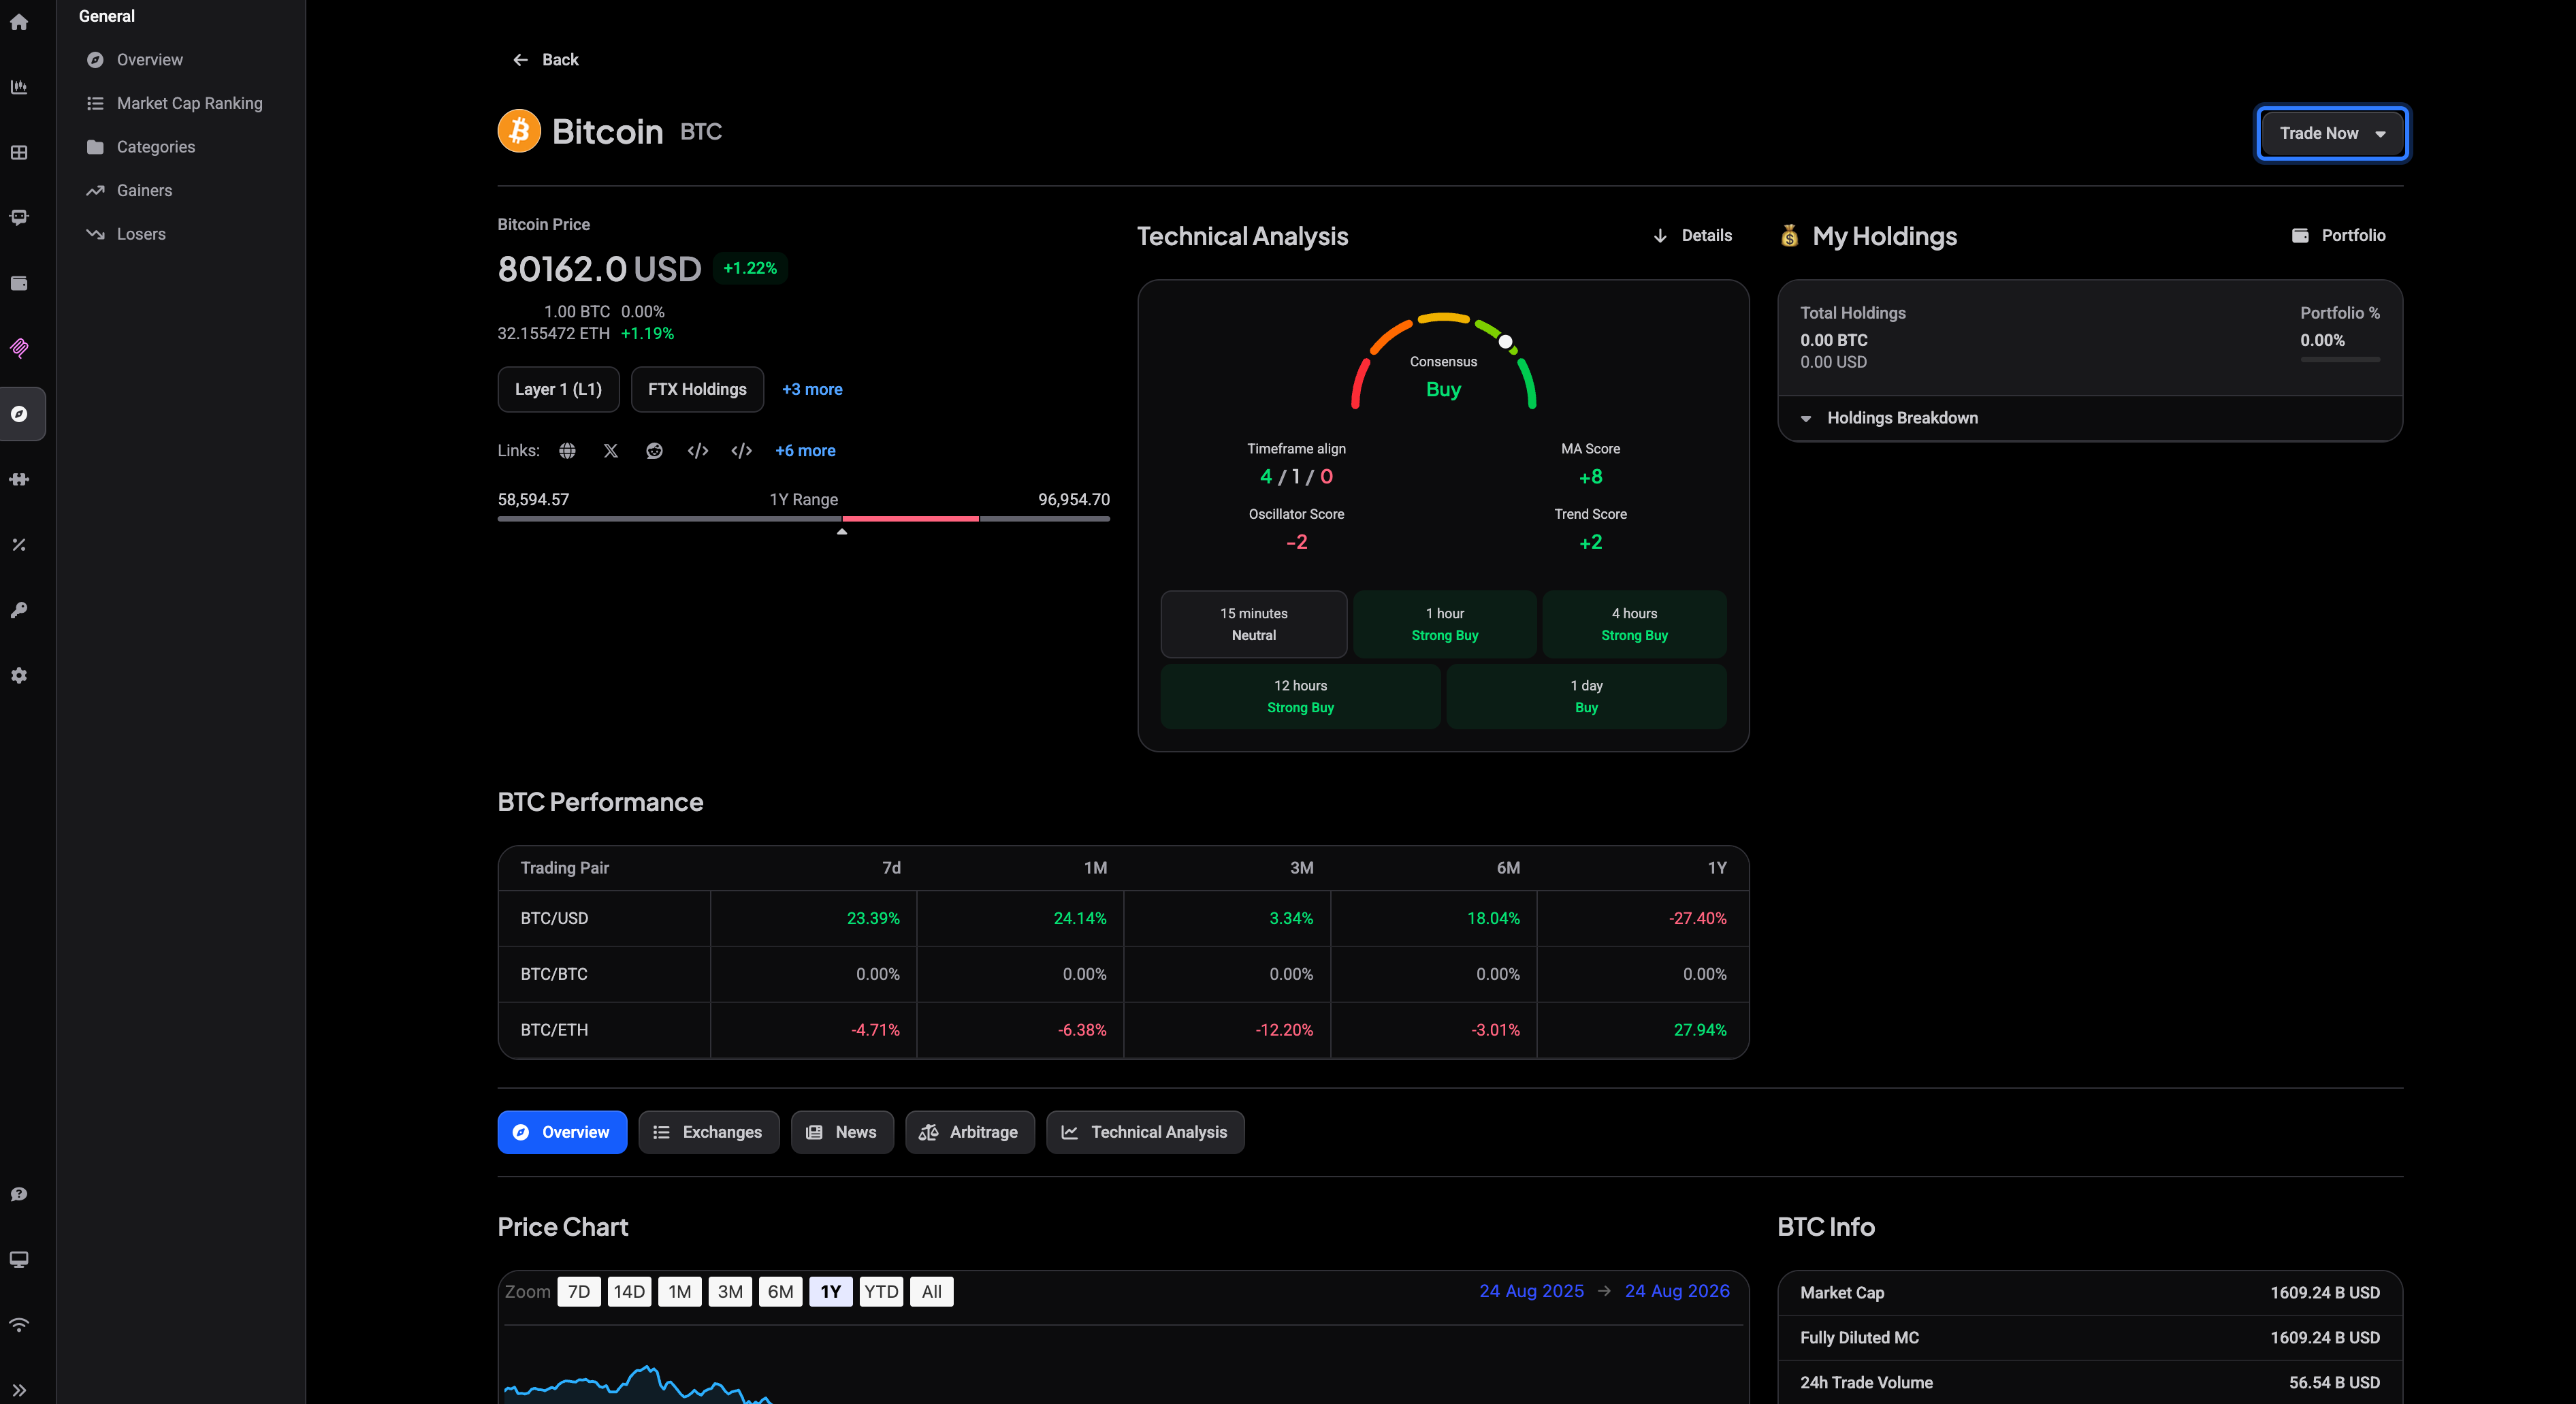
Every coin page opens with the coin’s name, logo, and ticker at the top, and a Trade Now button on the right that opens the trading terminal for that coin so you can place an order right away. Price alerts are not set from this header; they are handled through Altrady’s Alerts feature, linked at the end of this article.
Below that you’ll find the current price, its recent range, links to the project’s website and community pages, and a short performance table, then a row of tabs for drilling deeper: Overview, Exchanges, News, Arbitrage, and Technical Analysis. Each tab loads its own view without leaving the coin page, so it’s safe to click through all of them while researching.
Reading the price and range
Near the top of the coin page you’ll see the current price in USD, its 24-hour change, and its value in BTC and ETH. Underneath, a 1Y Range bar shows where today’s price sits between the coin’s low and high over the past year, a quick way to see if a coin is trading near its yearly extremes without digging through charts.
Your own holdings in that coin
On the right of the coin page sits My Holdings. It shows how much of the coin you hold, both in the coin itself and converted to your fiat currency, alongside Portfolio %: this coin’s share of your total portfolio. Expand Holdings Breakdown to see how that splits across your connected exchange accounts, with the amount and value held on each one. If you don’t hold the coin at all, the panel simply reads zero.
Following external links
The same area lists quick links out to the project’s website, blockchain explorers, and community channels (Twitter/X, Reddit, Telegram, Discord, source code) when Altrady has them on file. These open in your browser, they’re informational only and not run by Altrady, so treat them as you would any outside link.
Reading the Performance table
 🔍 Click the image to see a larger version
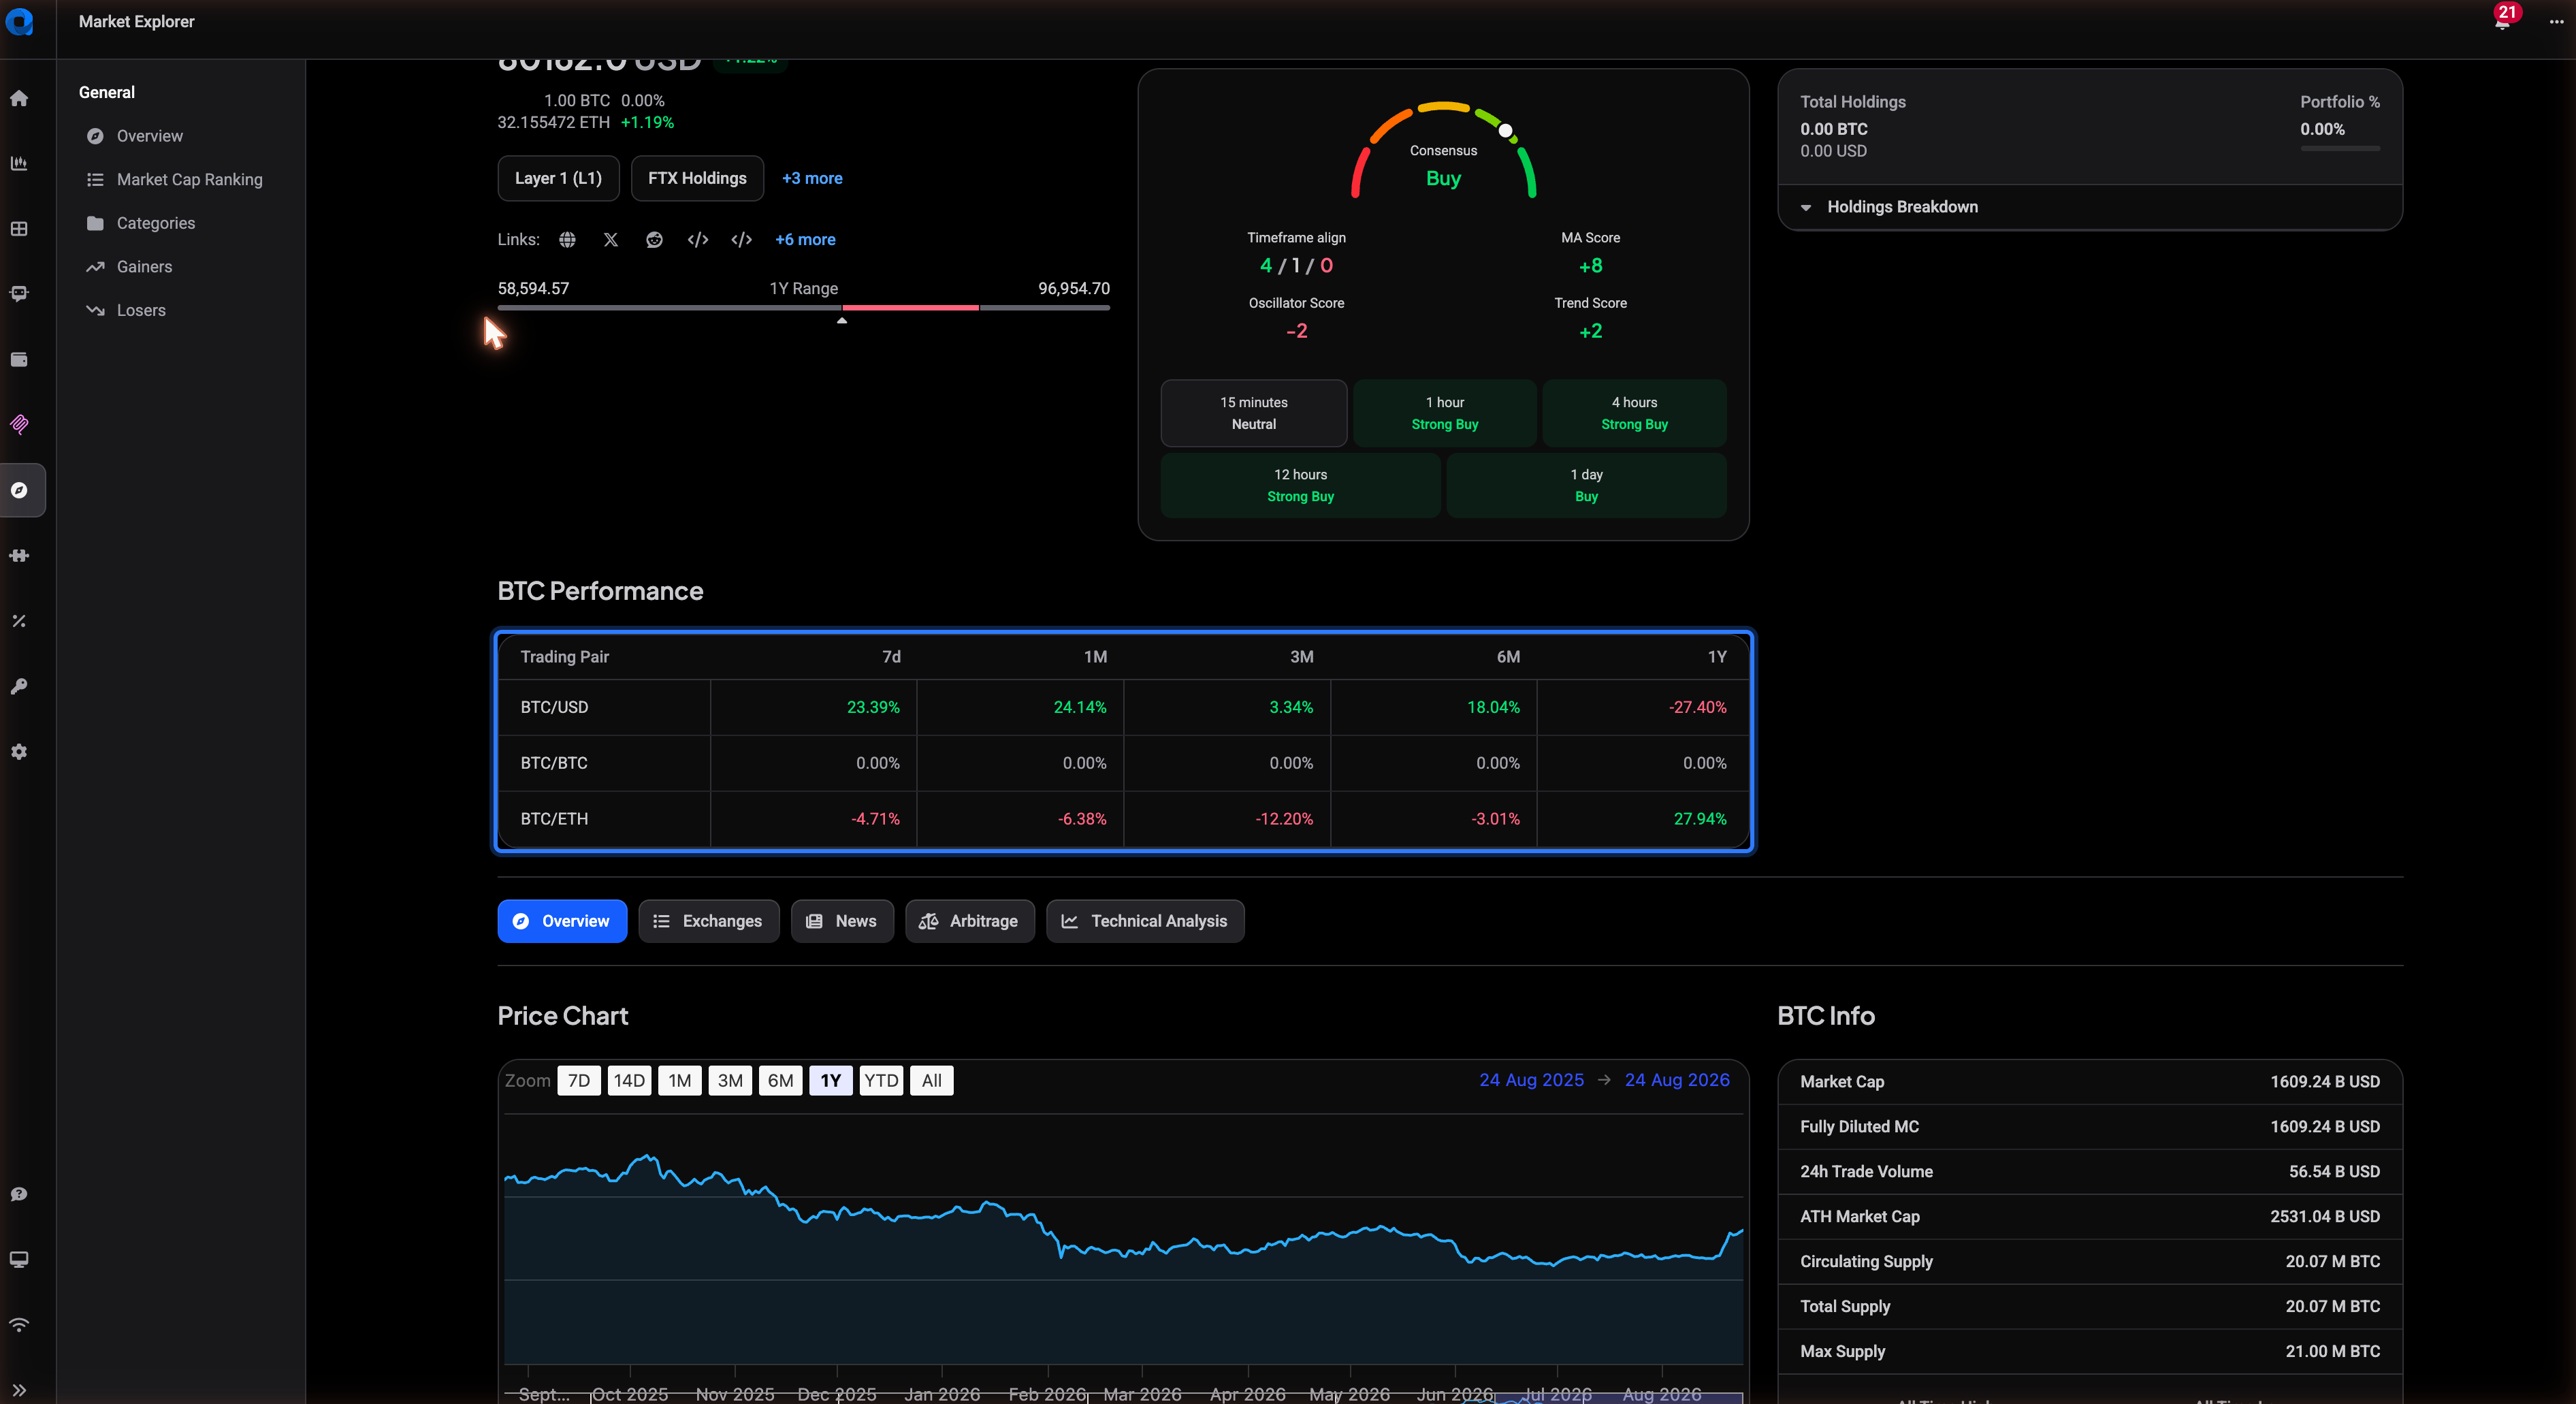
The performance table breaks the coin’s price change into 7D, 1M, 3M, 6M, and 1Y columns, one row per trading pair (for BTC, for example, BTC/USD, BTC/BTC and BTC/ETH). It’s a fast way to compare short-term moves against the longer trend before you decide where to look next. This is historical data only, it shows what already happened, not a forecast.
The Overview tab
 🔍 Click the image to see a larger version
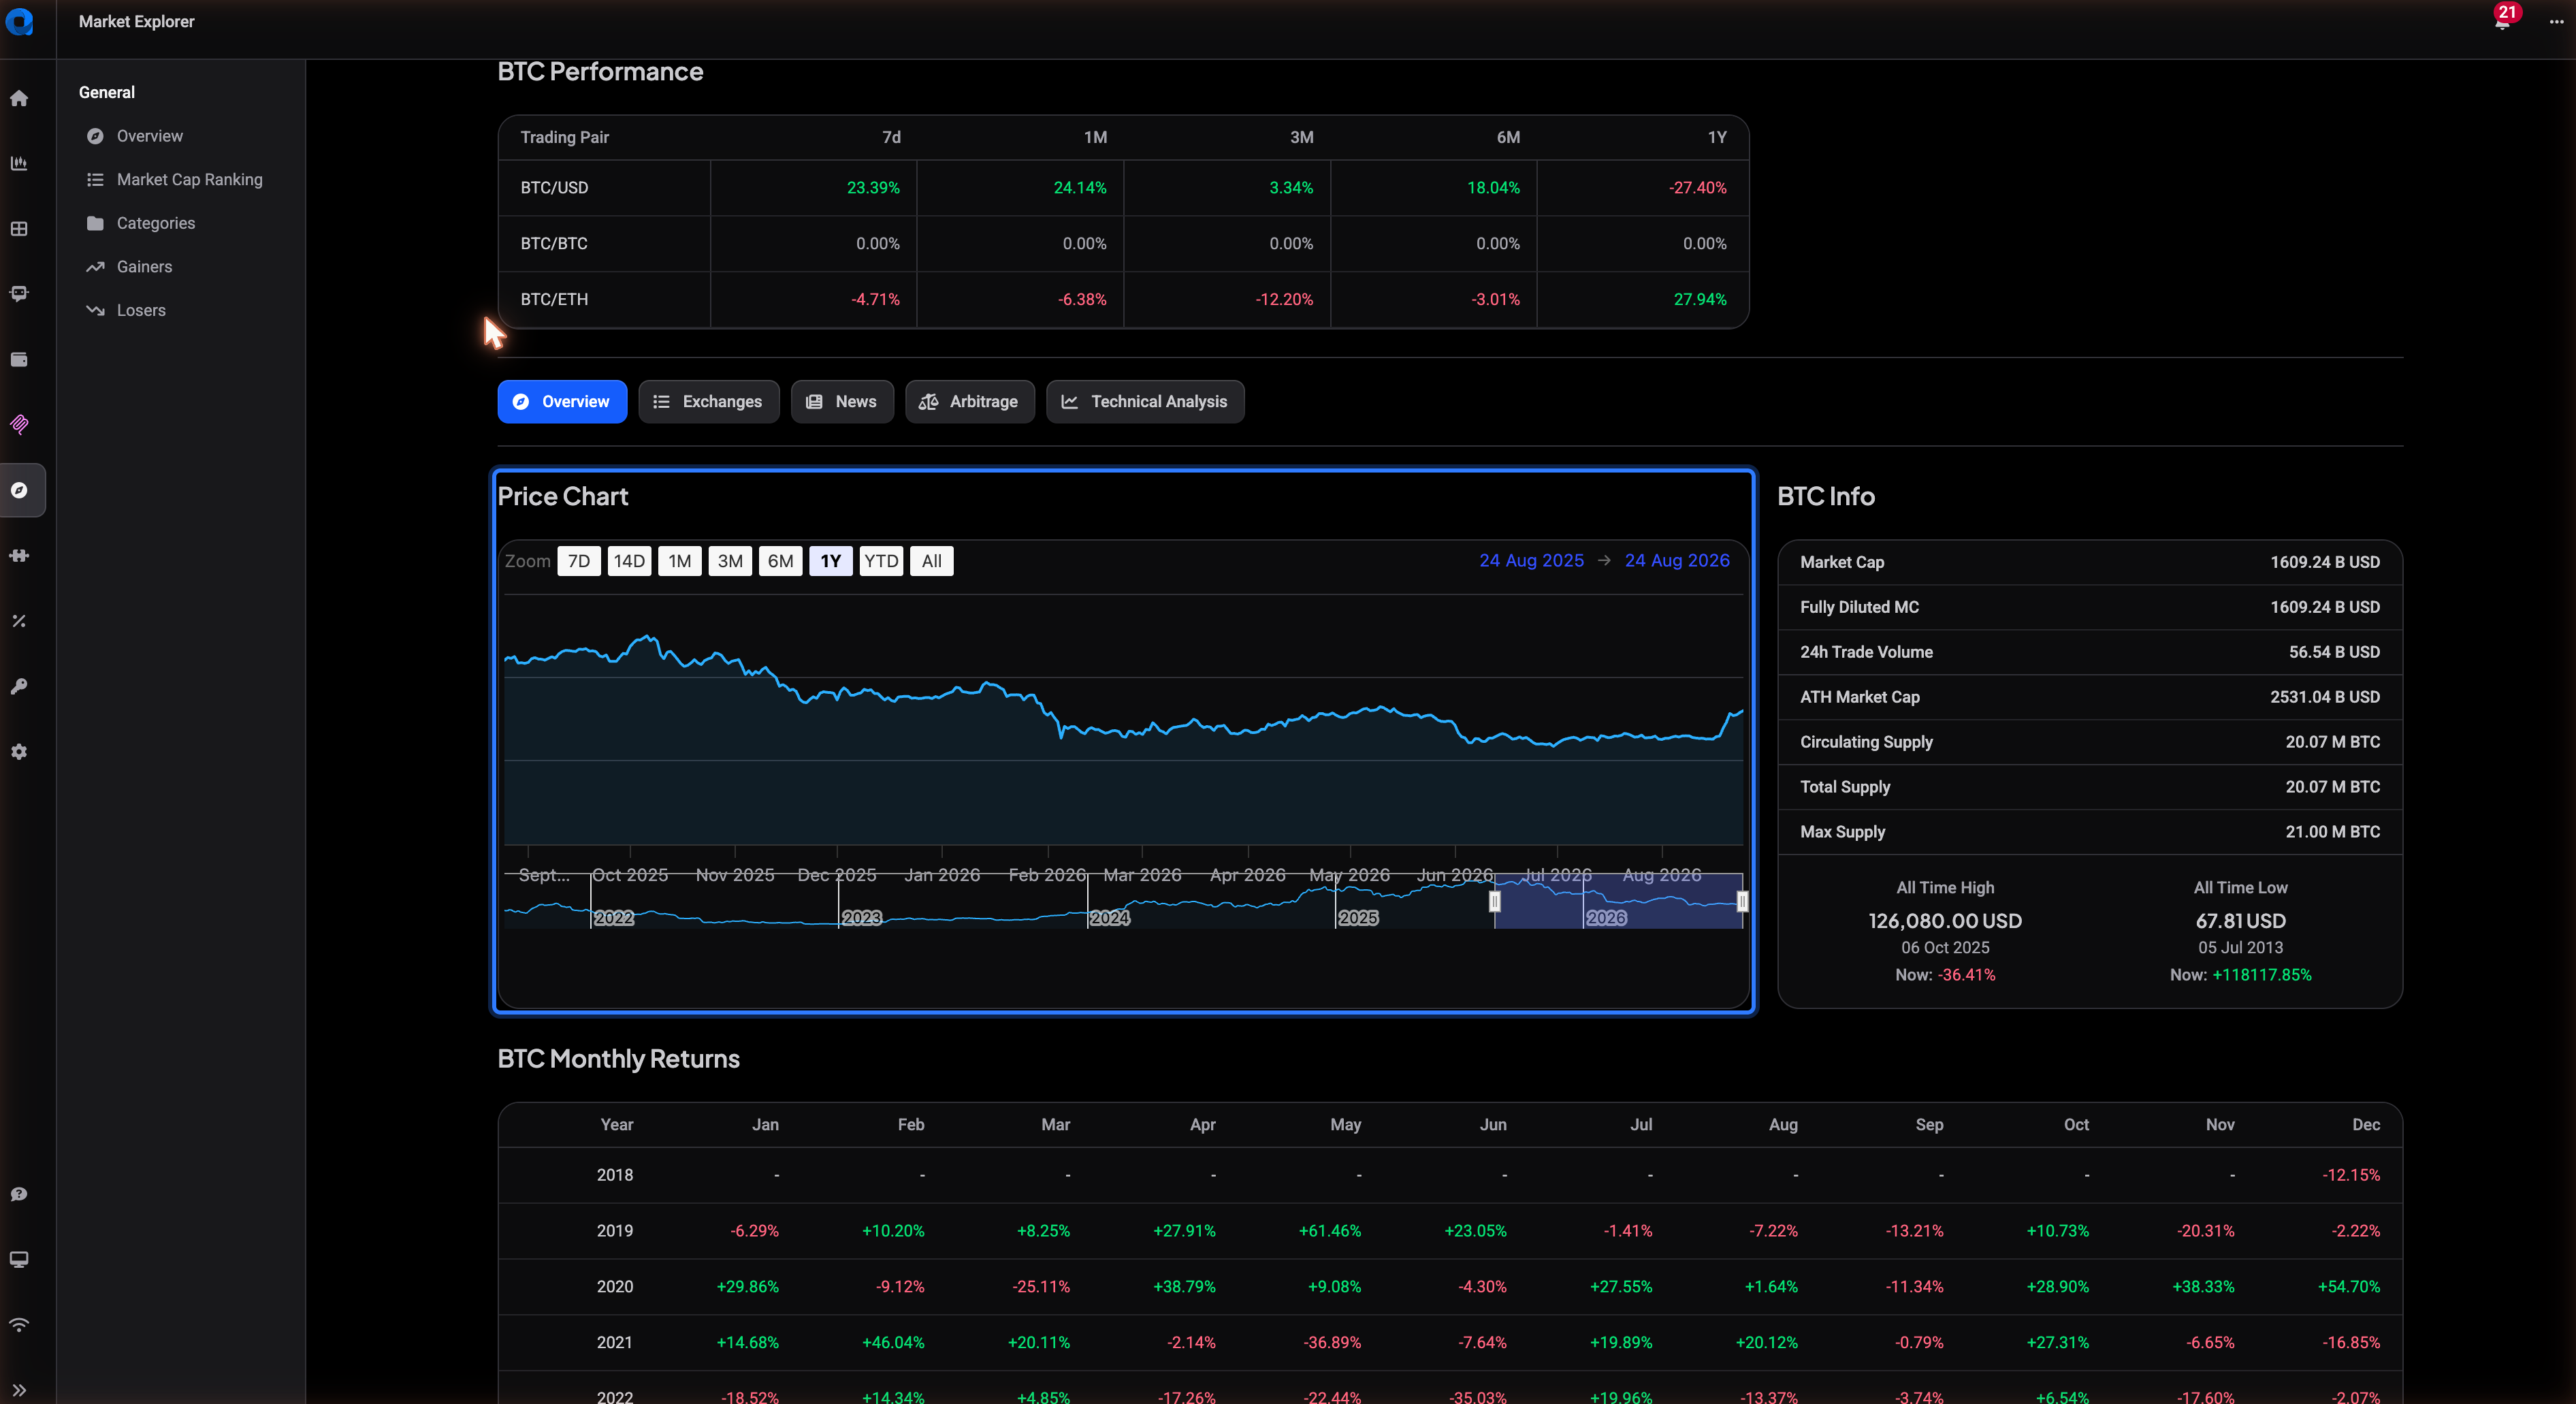
Click the Overview tab (it’s selected by default) to see:
- A price chart you can switch between ranges: 7D, 14D, 1M, 3M, 6M, 1Y, YTD and All.
- A stats card with market cap, 24h trading volume, circulating and total supply, plus the all-time high and all-time low price with the date each was hit.
- A monthly returns table showing the percentage change for each month across the years Altrady has data for, with average and median rows at the bottom.
- A short description of the project, gathered from public sources.
Checking exchanges, news, arbitrage, and TA
The other tabs round out your research:
- Exchanges lists where the coin trades and at what volume.
- News pulls in recent articles mentioning the coin. See Where can I read crypto news in Altrady?
- Arbitrage shows price differences for the coin across exchanges.
- Technical Analysis shows Altrady’s statistical indicator readout for the coin (moving averages, oscillators, and a summary score) based on historical price data, not a trading recommendation.
Where to go next
Once you’ve found a coin worth watching, you can:
- Set a price alert on it so Altrady notifies you when it moves. See How do I set a price alert in Altrady?
- Click Trade Now to jump straight into placing an order. Walk through your first order step by step in How do I place my first trade in Altrady?
Still stuck?
If a coin’s data looks off or a tab won’t load, reach out through in-app support chat and we’ll take a look.