
Understanding your position numbers: break-even, average entry, invested, and net PnL
Every open position in Altrady shows a Position Info widget with numbers like Invested, Average Entry Price (AEP), Break-Even Price (BEP), and Net PnL. This article walks through what each field means, why the break-even price moves differently from the average entry, and how to show the average-entry and break-even lines on your chart.
A few terms first
Two actions change a position, and they mean specific things here:
- Increase: adding to the position. This happens when an entry order fills.
- Reduce: taking some off. This happens when a take-profit order fills or partly fills (a partial close).
And two kinds of profit or loss:
- Realised PnL: the result from exits that have already filled.
- Unrealised PnL: the paper result on the coins you still hold, marked at the current price.
The examples below describe a long position. For a short, the direction of each price move is reversed, and the article flags this where it matters.
Where to find these numbers
Your position figures appear in a few places, at different levels of detail:
- Dashboard: a quick summary. It shows your Cost (what you put in), not the full breakdown.
- My Positions: the full list of your positions across every market, with a fair amount of detail on each. Here the headline values are Cost and Size (usually your quote and base amounts).
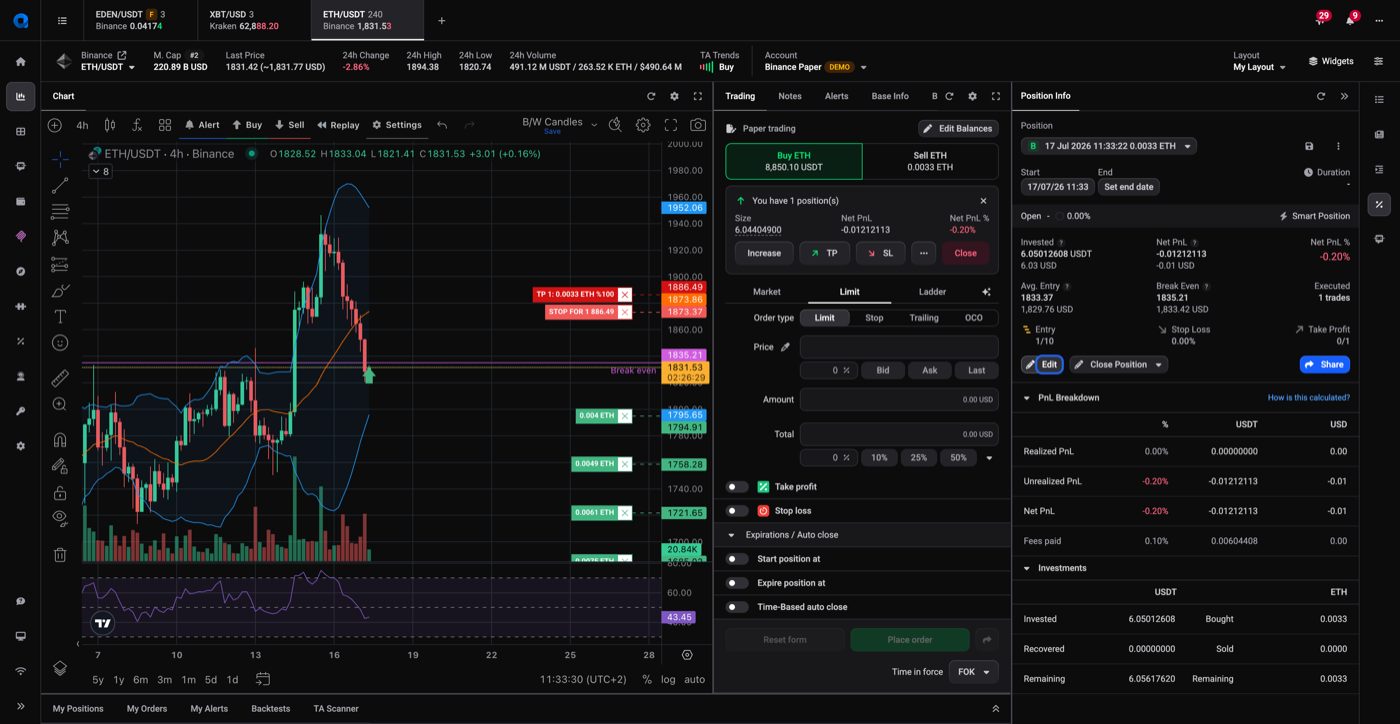
- Position Info widget: the deepest view, and the one this article is about. It covers the position on the market you currently have selected, with the complete set of numbers.
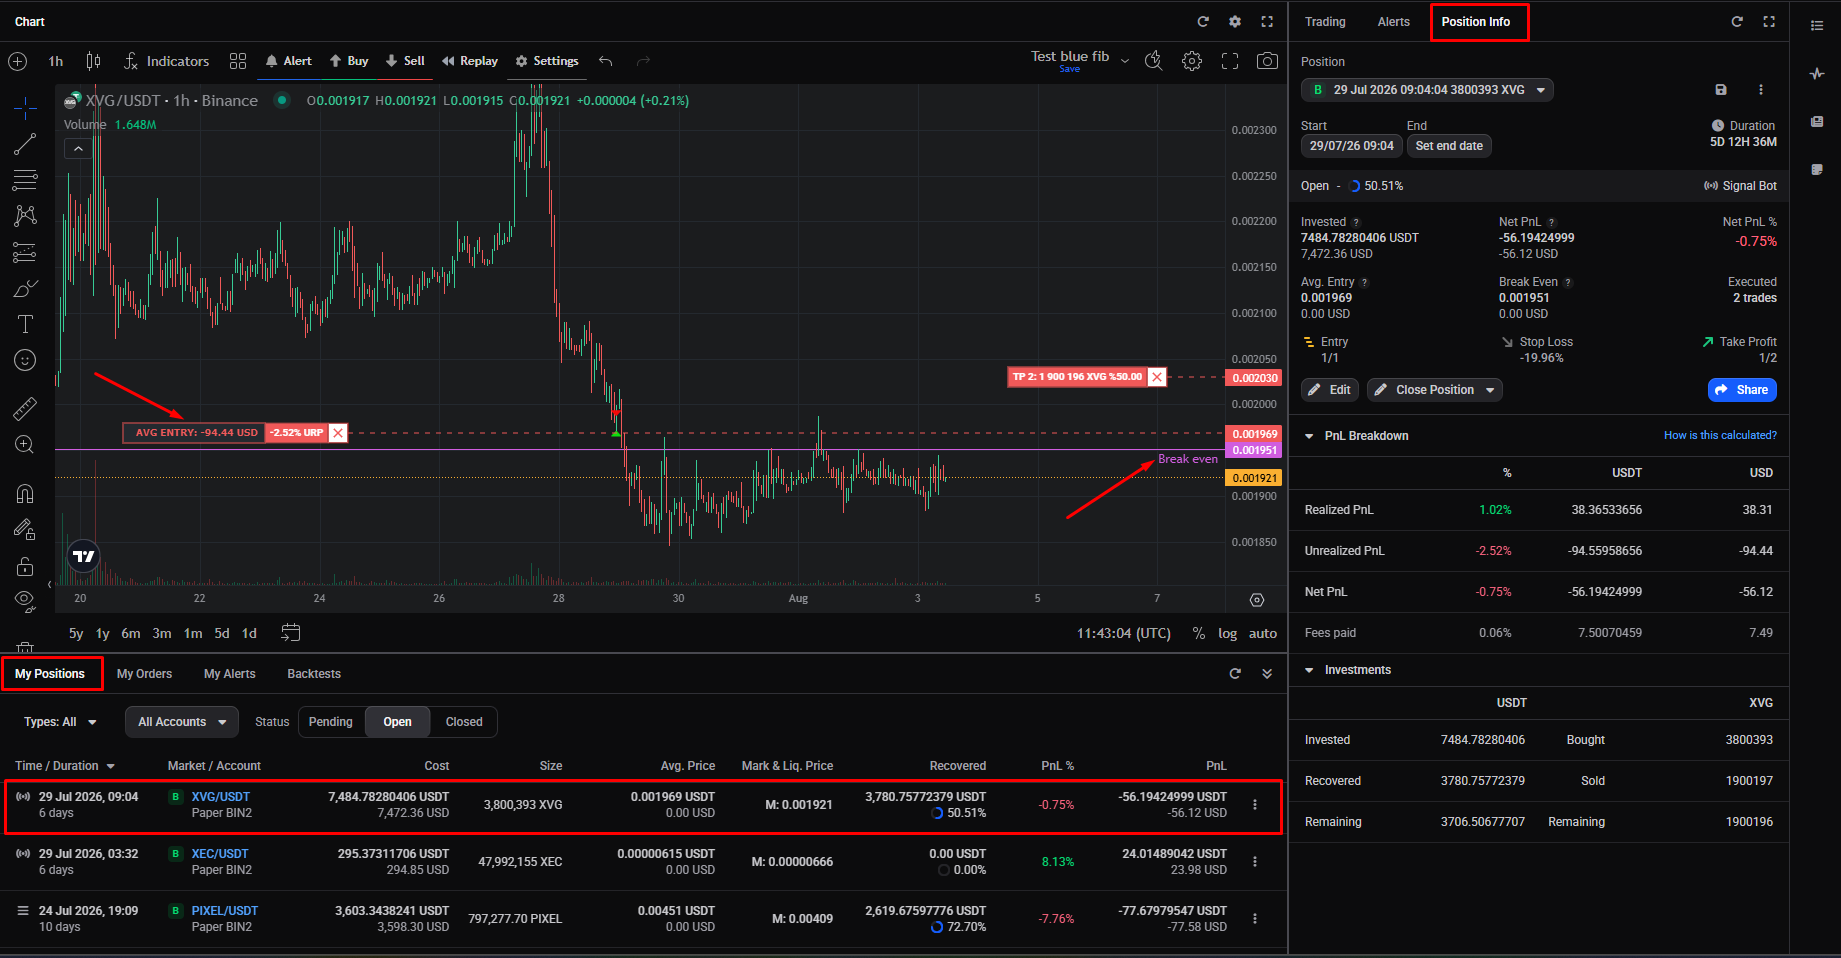
The average entry (AEP) and break-even (BEP) prices can also be drawn as lines directly on the chart (covered under Showing the average-entry and break-even lines on your chart, further down).
One label to watch as you move between views: what the Position Info widget calls Invested is shown as Cost on the Dashboard and in My Positions. It’s the same figure.
Showing and opening the Position Info widget
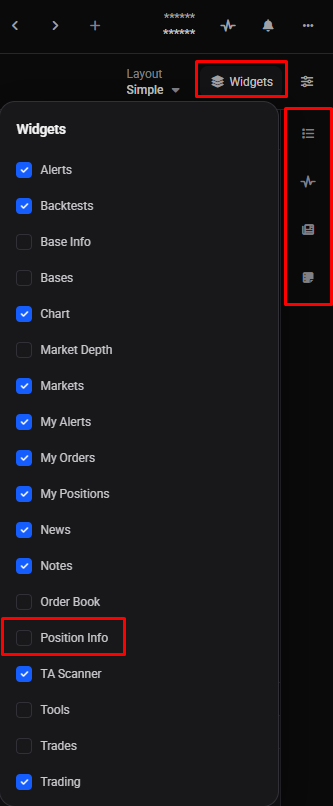
The Position Info widget isn’t shown on the default layouts, so you may need to add it first. How you do that depends on your layout:
- Simple layout: click in the trading widget to add the Position Info widget to that widget group, then turn it on from the widgets list.
- Advanced layout: the Position Info widget is in the right-hand widget list; click it to open it in the right side drawer.
 🔍 Click the image to see a larger version
For more on arranging widgets, see how do I add, remove, resize, and arrange widgets?.
The quickest way to see a position’s numbers is to left-click its market (for example from My Positions) to open that market in the trading terminal; the Position Info widget then shows that market’s position. If a market is already open, the widget shows its most recent open position, so often there’s nothing else to do. To look at a different position, pick it from either:
- the position controls in the trading widget, which list your open positions, or
- the Position dropdown at the top of the Position Info widget, whose list also includes closed positions.
 🔍 Click the image to see a larger version
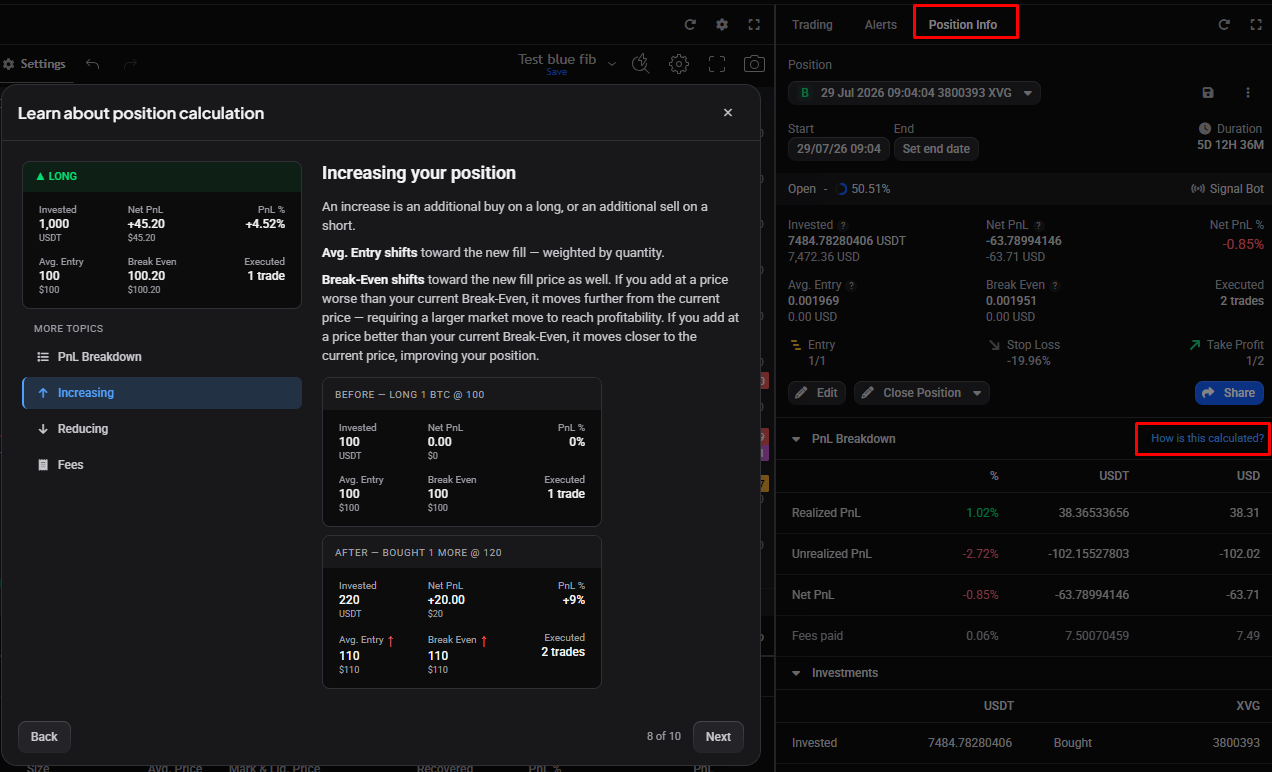
A small ? icon sits next to several fields in the Position Info widget; clicking it opens the in-app Learn about position calculation guide directly on that field’s tab, with worked examples. There is also an extended tutorial on the calculations found by clicking How is this calculated?
 🔍 Click the image to see a larger version
Invested and average entry (AEP)
Invested is the total of all your entries on the position so far, with your exits not deducted. Adding to the position (an entry filling) increases it; taking profit or closing does not bring it back down, and it never changes as price moves. For a spot long it’s measured in the quote currency you spent (like USDT). A spot short is the exception: it’s measured in the quote currency you receive when you sell the base coin, and its profit or loss lands in the base currency instead of quote. (Spot shorts work differently throughout; see how do spot short positions work?.) On a futures position it works the same way, and it is not your margin: Margin is shown as its own separate field.
Because Invested counts all your entries and doesn’t net off your exits, it can read higher than the open size your exchange shows, which does subtract your closes.
Average Entry Price (AEP) is the volume-weighted price of your entries, including the entry fees. It only shifts when you increase the position with an additional buy (on a long) or sell (on a short). Reducing or fully closing the position never moves it.
Break-even (BEP): why it isn’t your entry price
Break-Even Price (BEP) is the price at which closing the rest of your position would come out even. It accounts for your average entry, the fees you have already paid, the fees still to be paid on the exit, and any exits you have already taken (including whether those were in profit or loss).
Which side of the BEP you close on decides profit or loss:
- On a long, closing above the BEP makes a profit; closing below it makes a loss.
- On a short it’s reversed: closing below the BEP makes a profit; closing above it makes a loss.
While only entries have filled (no exits yet), the BEP and AEP sit very close together. The only difference is the estimated exit fees, which are included in the BEP but not in the AEP.
 🔍 Click the image to see a larger version
Once you start taking exits, the BEP moves, and unlike the AEP it moves on reduces as well as on increases:
- Increasing shifts the BEP toward the new fill price, the same way it shifts the AEP.
- Reducing at a profit lowers the BEP on a long (the banked gain means the rest needs less from the market to come out even). On a short it does the opposite and raises the BEP.
- Reducing at a loss raises the BEP on a long. On a short it lowers it.
Fees make only a very small difference between the AEP and the BEP. So if the BEP sits noticeably away from your entry price, that comes from your exits (a partial reduce that banked a gain or a loss), not from fees, and it is not a display error.
Increase vs reduce, at a glance
| Action | AEP | BEP (long) | BEP (short) |
|---|---|---|---|
| Increase (add to the position) | Shifts toward the new fill | Shifts toward the new fill | Shifts toward the new fill |
| Reduce at a profit | Unchanged | Moves down | Moves up |
| Reduce at a loss | Unchanged | Moves up | Moves down |
So if you added to a position and the break-even line didn’t move the way you expected, check whether the fill landed above or below your prior BEP. For the full DCA flow, see how to edit or scale into an open position.
Net PnL and the PnL Breakdown
Net PnL is your overall result on the position right now: realised plus unrealised, minus fees. The percentage figure next to it is calculated against your Invested amount, not against the BEP, so it reads as your return on the money you actually put in.
The PnL Breakdown splits Net PnL into three rows that add up to it:
- Realised: the result from exits that have already filled.
- Unrealised: the paper result on the coins you still hold, marked at the current price.
- Fees: the total trading fees paid so far. These are subtracted when working out your Net PnL.
Showing the average-entry and break-even lines on your chart
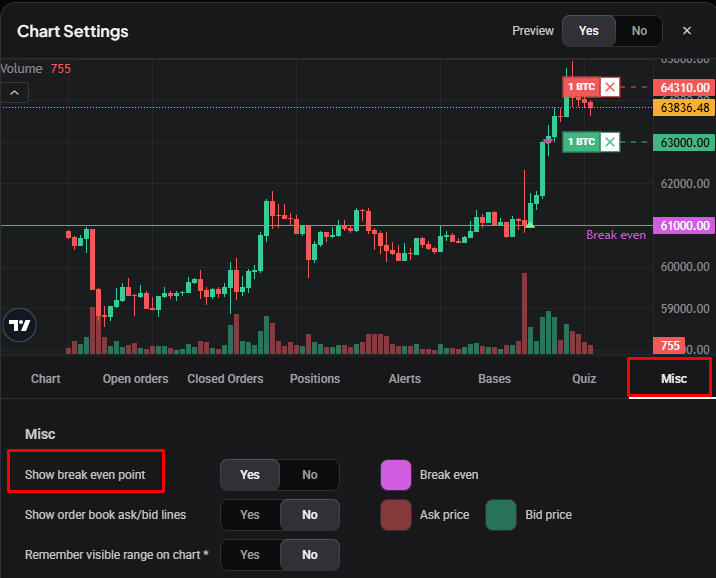
Altrady can draw both your average-entry and break-even prices as lines directly on the chart. They’re controlled by two separate chart settings (found under the Settings menu at the top of the chart):
- Average entry (AEP): enable Show Unrealized Average Entry price under the Positions section of the chart settings. The line is drawn green when the position is in profit and red when it’s in loss, and it carries a small box showing the current unrealised PnL amount and percentage.
- Break-even (BEP): enable Show break even point under the Misc section. The line is drawn in lilac.
 🔍 Click the image to see a larger version
If a line doesn’t appear, for example right after a partial reduce, click the resync arrow to refresh the position, and check that the setting is still enabled.
For moving your stop loss to break-even, see how to set or adjust take profit and stop loss.
When the break-even price isn’t shown
The BEP is worked out from the coins you still hold, so there are times it isn’t shown:
- When the position is closed with no coins left (or only dust), the AEP is still shown but the BEP is not, since there is nothing remaining for it to apply to.
- When the position is already in guaranteed profit: if you have banked enough on your exits that even giving the remaining coins away for nothing would still leave the position in profit, there is no price at which you would make a loss, so there is no break-even to show (it reads as blank or zero).
Still stuck?
If a number on your position still doesn’t match what you expect after reading this, reach out through support chat in the app and share a screenshot of the Position Info widget. The team can check it against your trade history directly.