
How do I view several charts at once?
Every tab in the Trading Terminal can show a grid of charts, from one up to eight, so you can watch several markets or timeframes side by side. This replaces the old Charts page, which no longer exists. It takes about a minute to set up.
Pick a grid layout
 🔍 Click the image to see a larger version
- Open the Trading Terminal and select a tab.
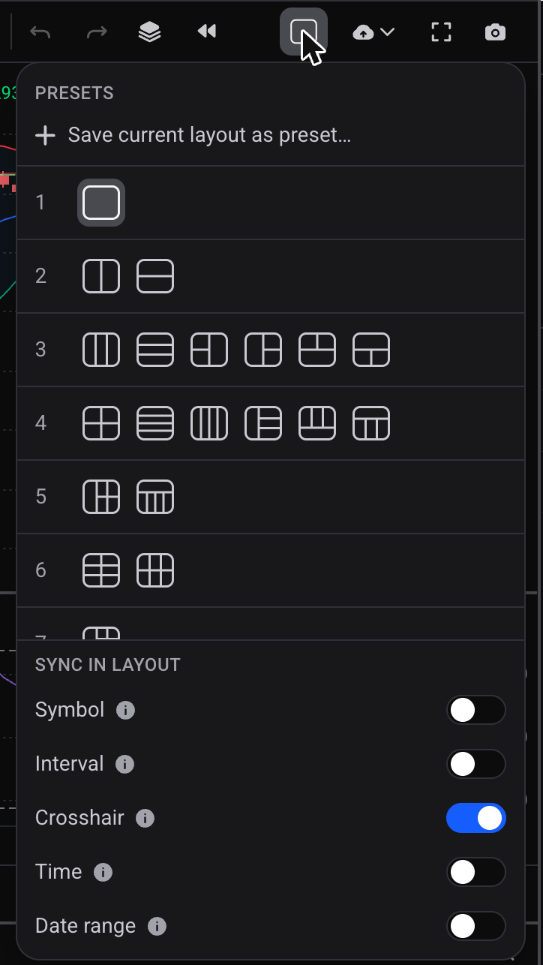
- Click the chart layout button in the chart’s top bar. It shows the arrangement you are using now.
- Pick an arrangement from the list. The layouts range from a single chart to eight, in different shapes (columns, rows and grids).
The grid belongs to the tab you are in, so each tab remembers its own arrangement.
Choose the market and timeframe of each chart
 🔍 Click the image to see a larger version
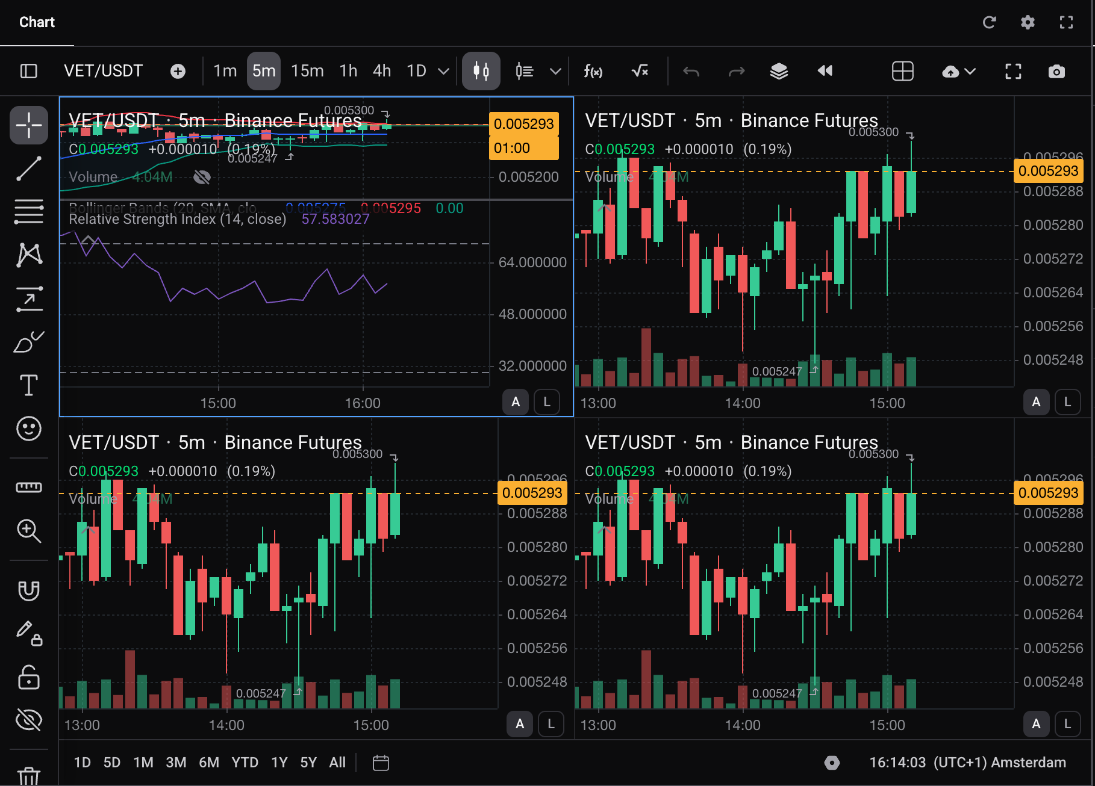
Click a chart to make it the active chart. The trading panel, the order book and the other market widgets follow the active chart.
To change the market of the active chart, change the market of the tab, for example by right-clicking the tab and choosing Change market. Only the active chart changes; the other charts keep their own markets. Each chart also keeps its own timeframe, unless you link them (see below).
Link charts together with Sync in layout
 🔍 Click the image to see a larger version
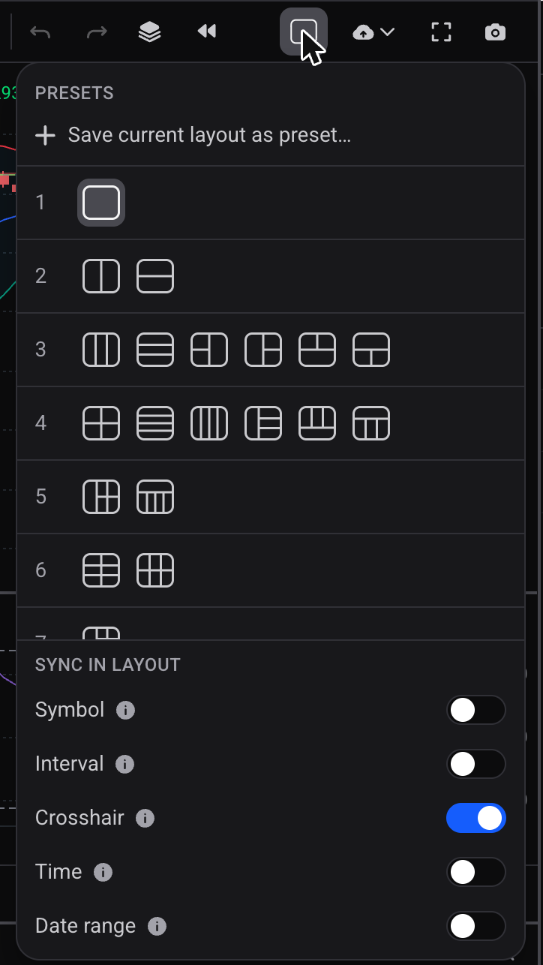
At the bottom of the layout list you find Sync in layout, with a switch for each of these:
- Symbol: changing the symbol on one chart changes it on every chart.
- Interval: changing the interval on one chart changes it on every chart.
- Crosshair: moving the crosshair on one chart shows it at the same time on every chart.
- Time: scrolling one chart scrolls every chart to the same point in time.
- Date range: picking a date range on one chart applies it to every chart.
Out of the box only Crosshair is switched on. Switch on the others when you want the charts to move together.
Save a grid as a preset
 🔍 Click the image to see a larger version
If you often use the same grid, save it once and reuse it.
- Set up the grid the way you like it, with the timeframes and indicators you want on each chart.
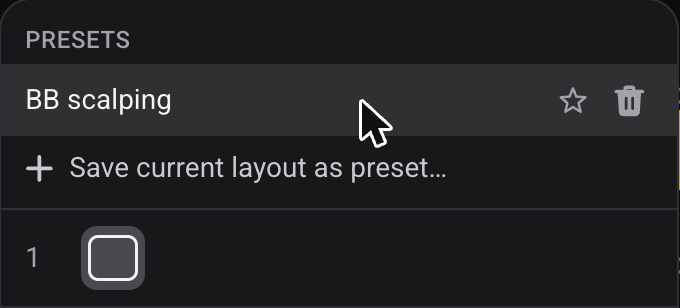
- Open the chart layout list and click Save current layout as preset….
- Give the preset a name and save it.
Your presets are listed under Presets at the top of the layout list. Click one to apply it to the tab you are in. A preset stores the arrangement, the chart sizes, the sync switches, and each chart’s timeframe, indicators and scripts, but not the markets: every chart takes the market of the tab. Use the star (Set as default) to make a preset the default, so new tabs open with it, or the bin (Delete) to remove one.
Use a second window
On the desktop app you can also click New Window in the top bar, next to Widgets, to open the market you are looking at in a second window, handy for a second monitor. The button is not available in the web version.
Good to know
- While you use chart replay, the tab shows a single chart. Your grid comes back when the replay ends.
- The Charting terminal layout gives the chart the whole screen, which suits a large grid. See Terminal layouts: Simple, Advanced, Charting and Script Editor.
- For tabs, widgets and the rest of the terminal, see Learn the trading terminal.
Still stuck?
If the chart layout button is missing or a grid doesn’t look the way you expect, reach out through support chat and tell us which tab and layout you are using.