
Understanding your grid bot's reports and performance
Open a grid bot from the Bots page and its detail view splits into tabs: Overview for the headline numbers, Levels for every completed trade, Analytics for performance over time, and Settings for the bot’s configuration. All of them stay available whether the bot is running or stopped.
Overview: the headline numbers
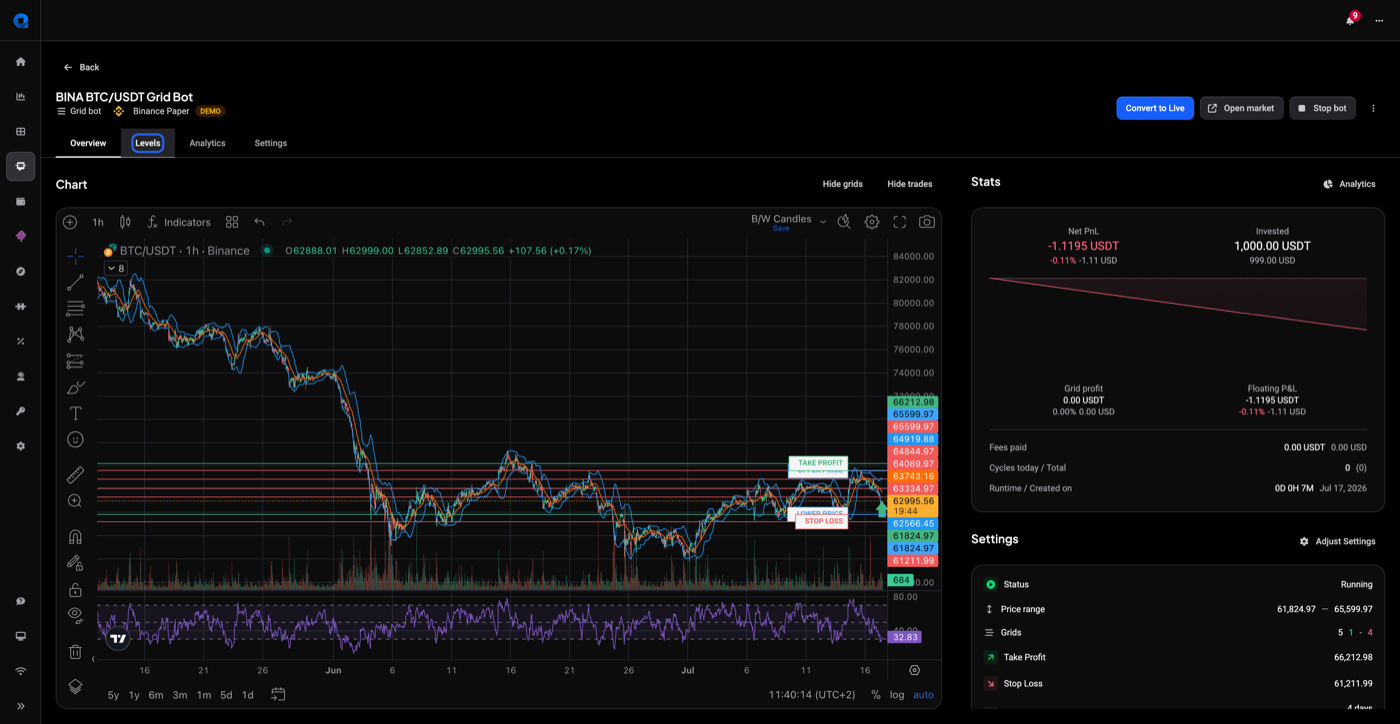
The Overview tab shows the market chart with the bot’s orders on it, a statistics card, and a summary of the bot’s settings.
The statistics card carries:
- Net PnL: Grid Profit plus Floating PnL. On a stopped bot this becomes the close-out PnL.
- Invested: the size you set in the bot’s settings, meaning the funds allocated to the bot.
- Grid Profits: the profit calculated by matching up pairs of filled orders, each buy with the sell that closed it or each sell with the buy that closed it.
- Floating PnL: the current value of coins the bot has bought but not yet sold.
- Fees paid: the total trading fees the bot’s trades have incurred.
- Cycles today / Total: a count of the completed trades.
- Runtime / Created on: how long the bot has been going, and when you made it.
 🔍 Click the image to see a larger version
The settings summary alongside it shows the bot’s status (Running or Stopped), price range, number of grids, take profit, stop loss, and time-based auto-close.
What Net PnL is made of
This is where most questions come from, so it’s worth separating the two halves.
Grid Profits is money already banked. Every time one of the bot’s orders is matched by the opposite order that closed it, that completed pair contributes. It only moves when a cycle completes.
Floating PnL is unrealized. It’s what the coins the bot currently holds are worth right now, and it moves with the market every minute. A bot part-way through a cycle will always have some floating PnL, and it can be negative while price is below where the bot bought.
Net PnL adds the two together, which is why it moves even on a day the bot hasn’t completed a single trade.
One thing to keep straight about fees. Fees paid is shown as its own figure, but it isn’t an amount still waiting to be subtracted: the PnL figures are already net of trading fees. The separate line is there so you can see what the bot has cost you to run, not so you can deduct it again.
Levels: every completed trade
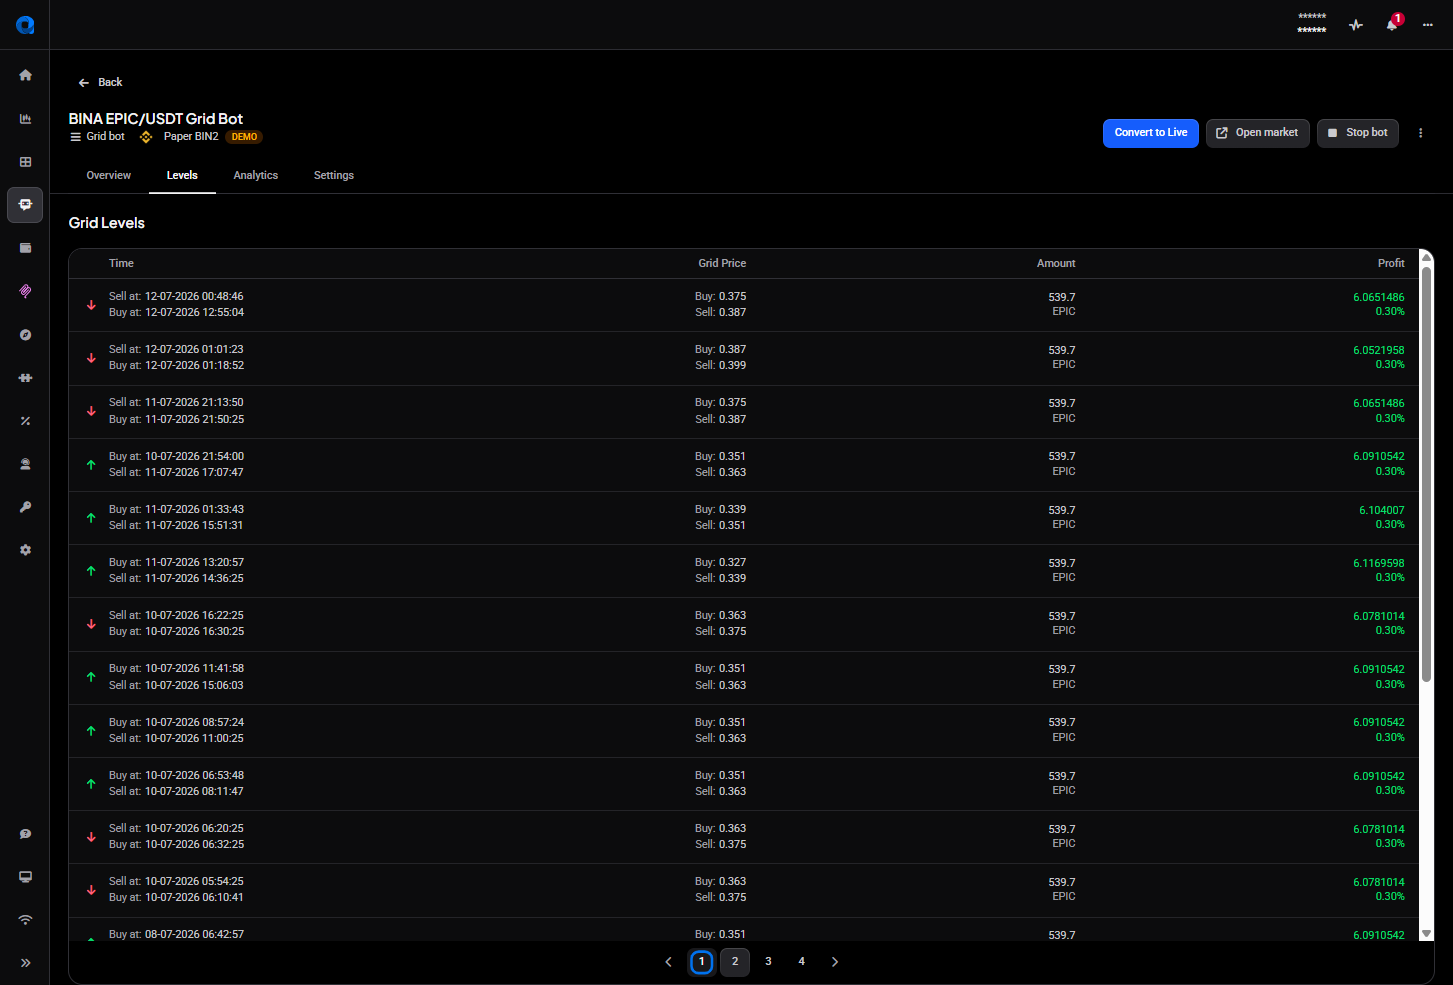
The Levels tab lists the grid trades the bot has finished, under the heading Grid Levels, in four columns:
- Time: when each side of the pair executed.
- Grid Price: the buy and sell price levels for that pair.
- Amount: the quantity traded, with partial fills noted.
- Profit: what that pair made, as a value and a percentage.
Every row is one completed cycle, made of two matched orders, and a cycle can start from either side. The coloured arrow at the left of the row tells you which: green where the bot bought first and later sold higher, red where it sold first and later bought back lower. The two times are listed in that same order.
Selling first is perfectly normal, not a sign anything is off. The bot holds base currency from the moment it starts, so if price rises before it falls, the sell side of a level fills first.
 🔍 Click the image to see a larger version
This is the tab to open when you want to check the bot’s actual behaviour rather than its summary: it shows you which levels are working and how long a round trip is taking. Longer runs page the list, so older cycles are still there behind the pagination at the bottom.
Analytics: performance over time
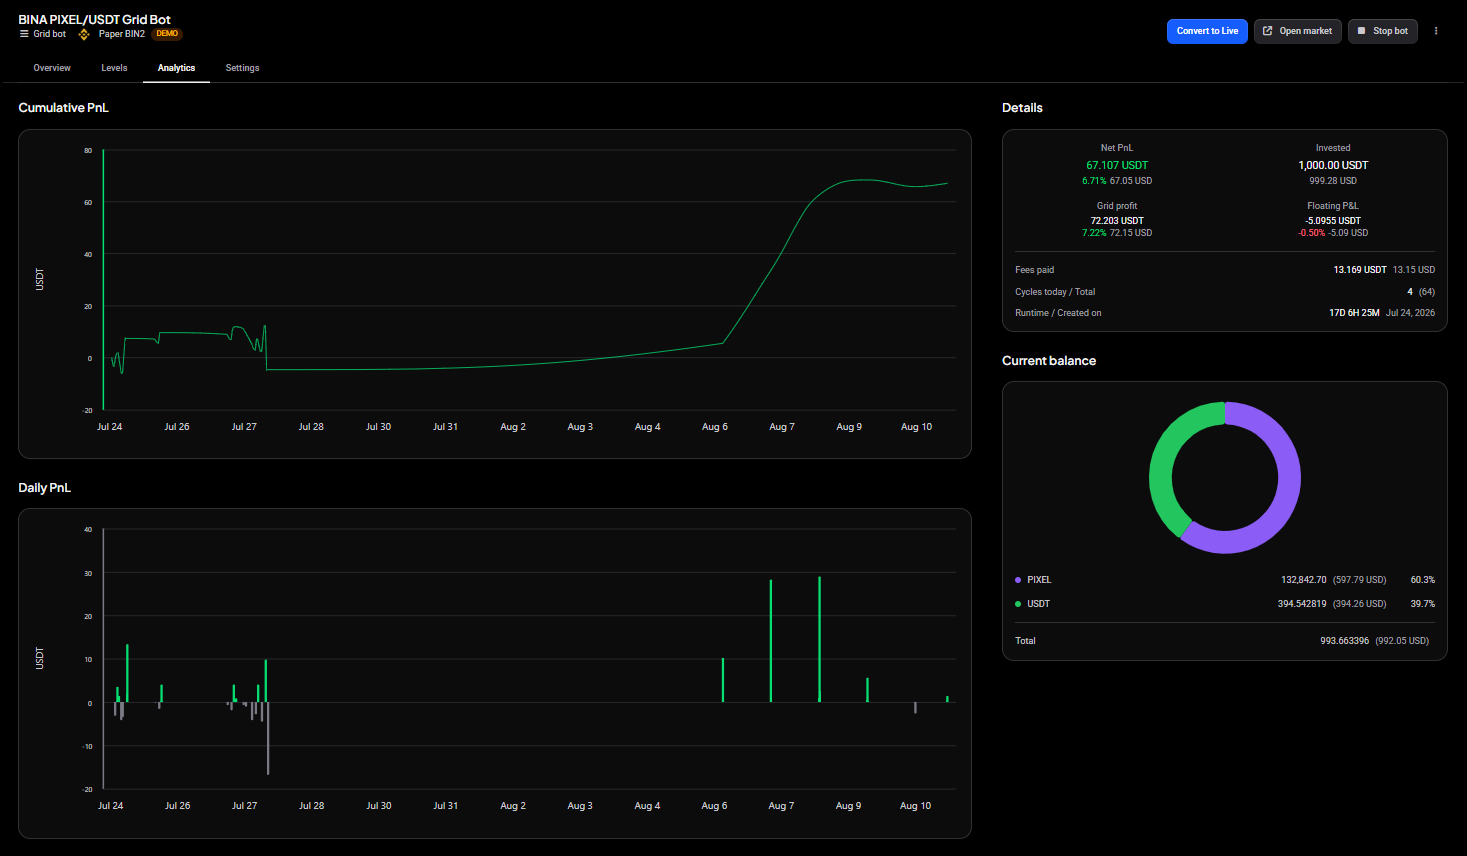
The Analytics tab turns the same data into charts:
- Cumulative PnL: how the bot’s total profit and loss has changed over time, in the quote currency.
- Daily PnL: the result for each individual period.
- Details: a summary of the key statistics.
- Current Balance: the asset distribution the bot is holding right now, and its total value.
 🔍 Click the image to see a larger version
Settings: the bot’s configuration
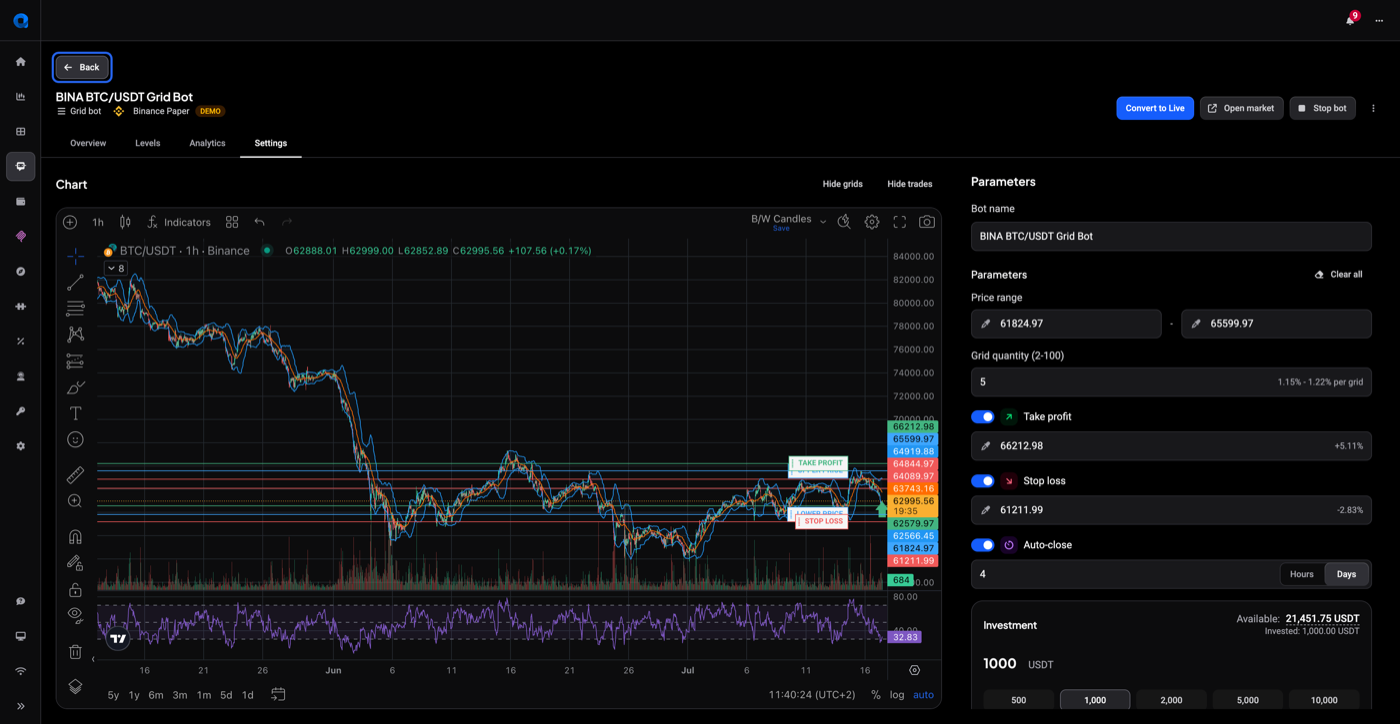
The Settings tab holds the bot’s configuration: its name, price range, grid quantity, take profit and stop loss toggles with their values, auto-close duration, and the investment amount.
 🔍 Click the image to see a larger version
Changing anything here restarts the bot, replacing its orders on the exchange. See How to edit or stop a grid bot.
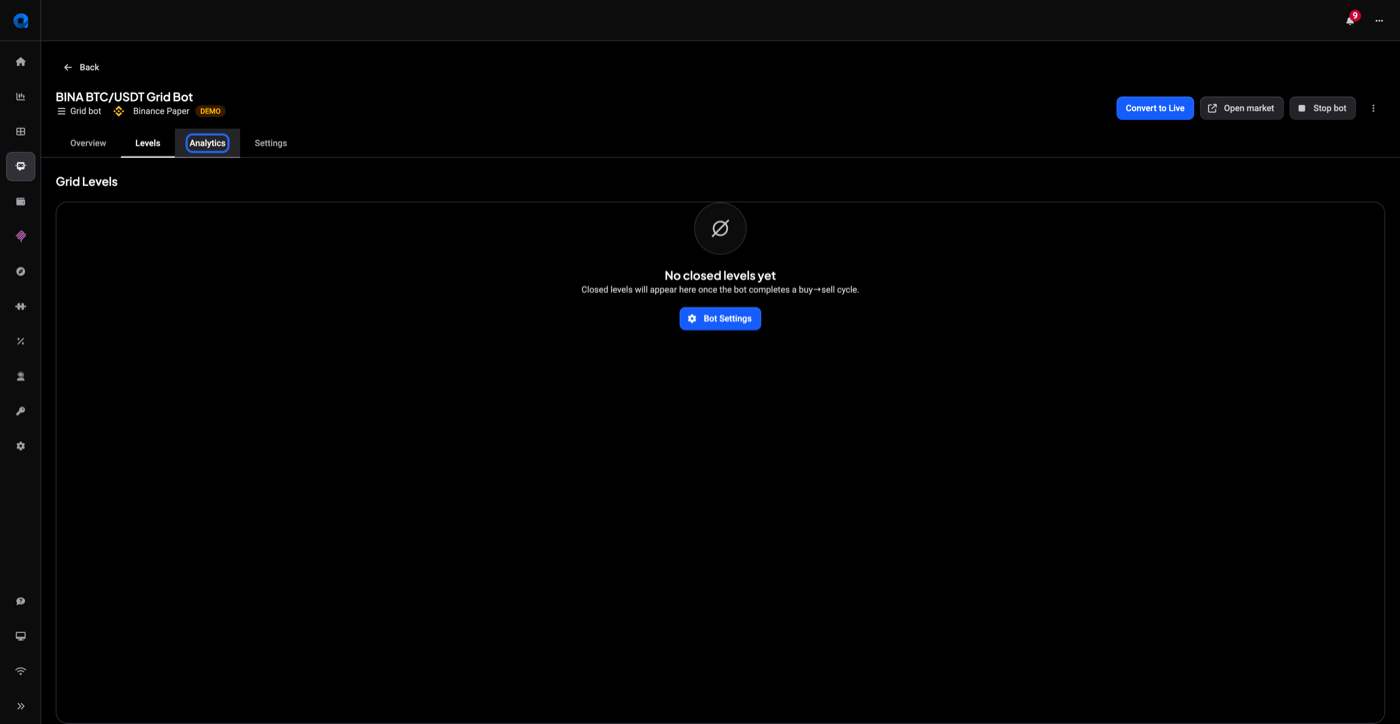
“No closed levels yet”
A new bot shows an empty Analytics tab with a No closed levels yet message. That’s expected: the bot hasn’t completed a full buy-and-sell cycle, so there’s nothing to chart. It fills in on its own once the first cycle closes.
 🔍 Click the image to see a larger version
If the bot has been running a while and this is still showing, that’s a different situation: see Grid Bot Not Trading or Placing Orders?.
Your numbers survive edits and restarts
Editing a grid bot restarts it, and stopping and starting one later has the same effect on its orders. Nothing about your record is wiped. Grid Profits, the Levels list, and the Analytics history all carry on from where they were, so a bot you have re-ranged several times still shows its full record rather than starting from zero.
Floating PnL carries across too. The bot goes on measuring the coins it holds against what it actually paid for them, so a restart does not re-base the unrealized figure and Net PnL does not jump at the moment you save an edit.
The coins come with it. Everything the bot is holding moves into the restarted bot, including any coins that fall outside a narrower range you have just set, so nothing drops out of the bot’s accounting when you tighten the grid.
So the Net PnL you see after an edit is still the whole picture: grid profit banked since the bot was created, plus what everything the bot currently holds is worth at the current price. It can still move sharply just after a restart, but that is the market moving, not the counter resetting.
Still stuck?
If a number here doesn’t match what you see on your exchange, first check the Current Balance panel on the Analytics tab against your exchange balance for that pair: it lists exactly what the bot is holding, and a bot that is part-way through a cycle holds base currency the exchange shows as a plain balance. If the bot looks like it has stopped trading altogether, see Grid Bot Not Trading or Placing Orders?. If the figures still don’t line up, reach out through support chat with the bot’s label, the market, and a screenshot of the tab you’re looking at, and the team can trace it with you.