
Understanding Your Signal Bot's Reports and Performance
 🔍 Click the image to see a larger version
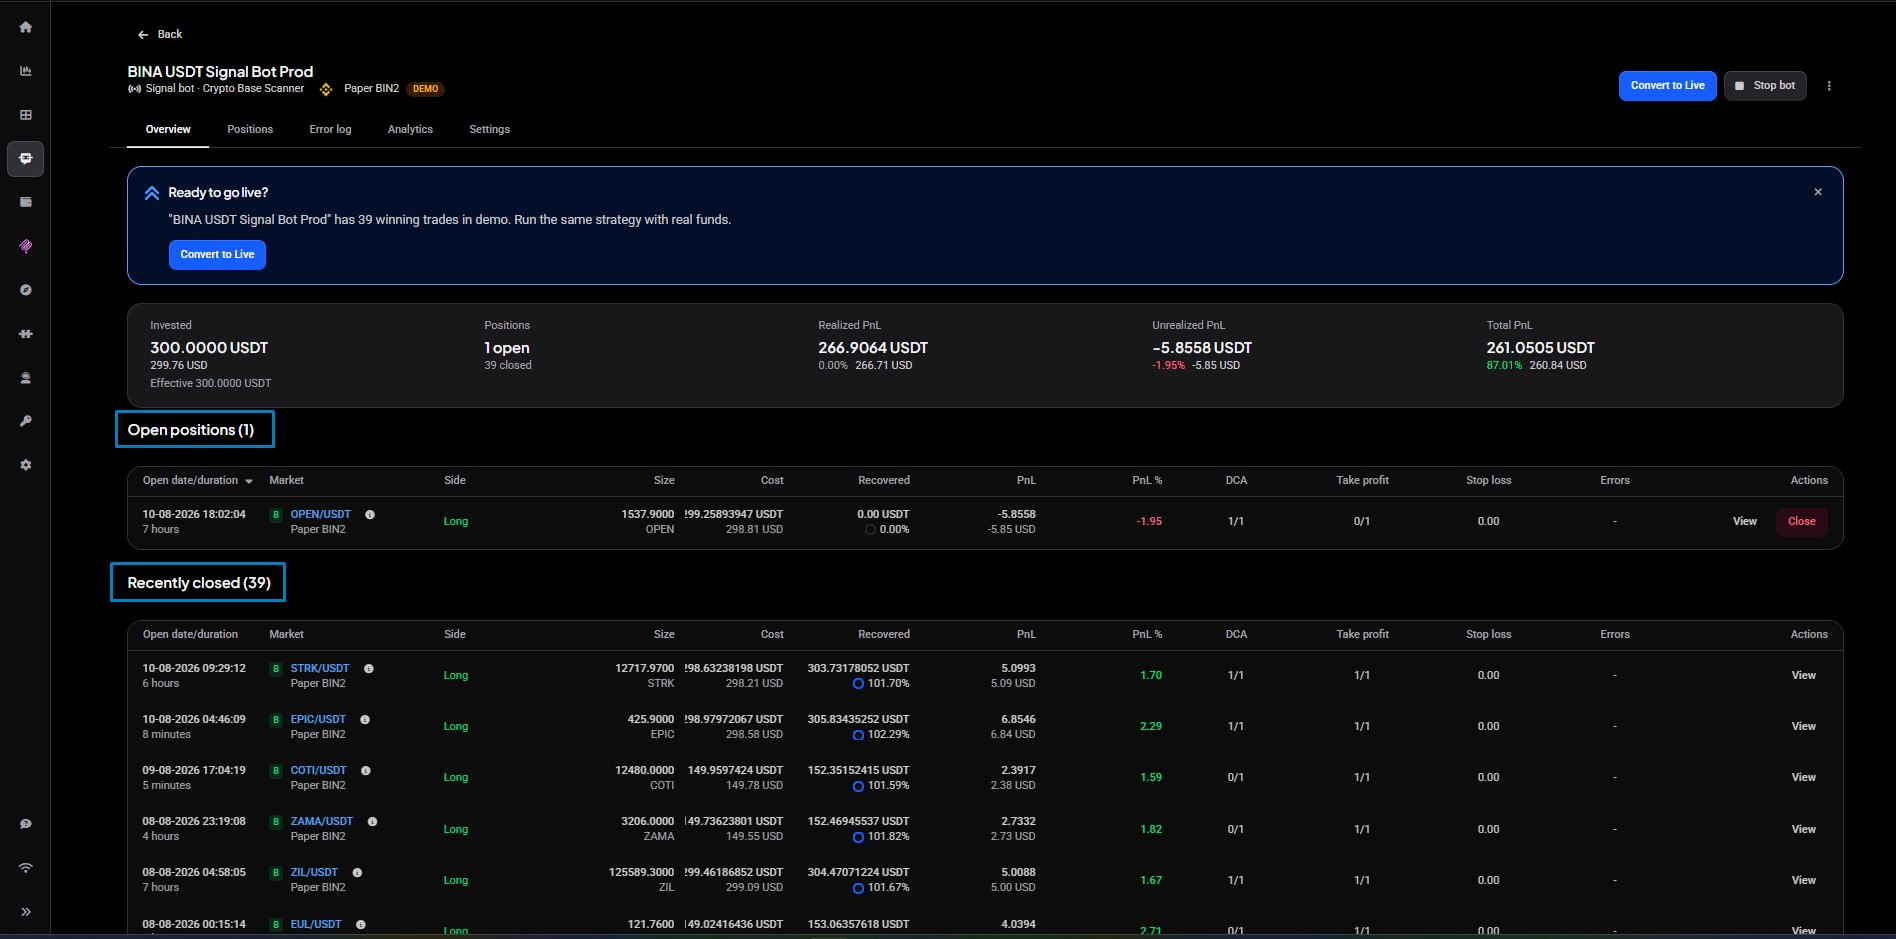
A signal bot keeps a full record of how it has traded, and most of it lives on the bot’s Analytics tab. Open a signal bot from the Bots page and you’ll find its performance broken down there: headline numbers, a session-by-session history, breakdowns by market and by how deep the DCA went, and charts over time. This article walks through what each part means, then answers the two questions we hear most.
🔍 Click the image to see a larger version
A signal bot keeps a full record of how it has traded, and most of it lives on the bot’s Analytics tab. Open a signal bot from the Bots page and you’ll find its performance broken down there: headline numbers, a session-by-session history, breakdowns by market and by how deep the DCA went, and charts over time. This article walks through what each part means, then answers the two questions we hear most.
The headline numbers
 🔍 Click the image to see a larger version
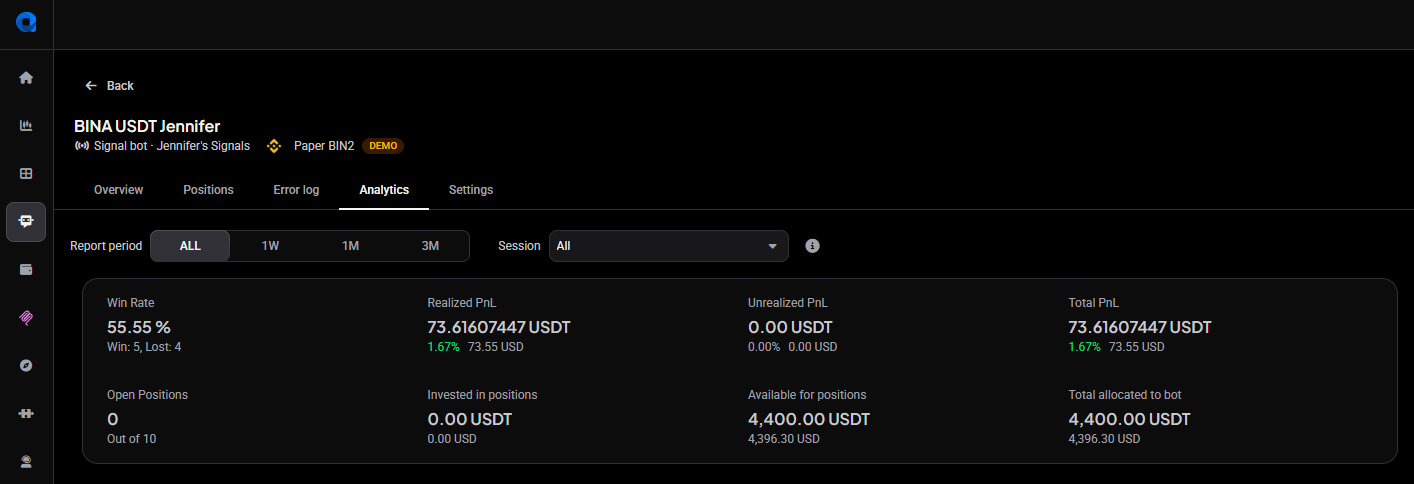
At the top you get the bot’s totals at a glance:
🔍 Click the image to see a larger version
At the top you get the bot’s totals at a glance:
- Allocated Amount: the capital the bot is allowed to work with.
- Realised PnL: profit or loss booked from positions that have closed.
- Closed Positions: how many have closed, with a win and loss split.
- Win Rate: the share of closed positions that ended in profit.
- Open Positions: how many are open right now.
- Open Position Investments: the capital currently tied up in those open positions.
- Unrealised PnL: the profit or loss on the open positions as they stand, not yet booked.
- Available Funds: the capital not currently deployed.
One thing that saves confusion later: every PnL figure in Altrady is net of exchange fees. The fees have already been taken out, so you don’t subtract them again.
Sessions: comparing one configuration against another
 🔍 Click the image to see a larger version
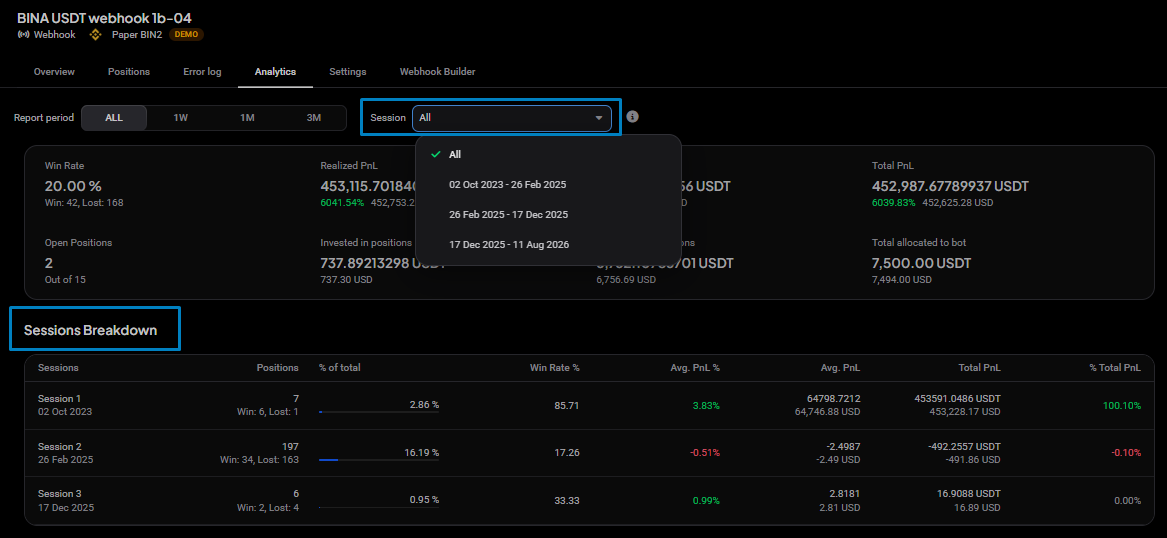
The analytics are organised into sessions, and this is the idea worth understanding. A new session begins when you change the bot’s filter settings, save them, and the bot then receives a new signal. Everything the bot does under one set of filters belongs to one session.
🔍 Click the image to see a larger version
The analytics are organised into sessions, and this is the idea worth understanding. A new session begins when you change the bot’s filter settings, save them, and the bot then receives a new signal. Everything the bot does under one set of filters belongs to one session.
That lets you compare configurations honestly. If you tightened a filter last week, its session is separate from the looser one before it, so you can see how each actually performed rather than blending them into one average.
The Sessions Breakdown table lays them side by side, with a row per session showing its number of positions, win rate, average PnL % and average PnL, and total PnL and total PnL %.
Breakdowns: where the results came from
Three more tables slice the same closed positions a different way, so you can see what’s actually working:
- By DCA: grouped by how many DCA orders filled before the position closed, so you can see whether the deep averaging-down is helping or just tying up funds.
- By volume: grouped by market-volume category.
- By market: grouped by trading pair.
The summary tables
Two tables sum the bot up.
The first is trade statistics: total volume traded, fees paid, runtime, average PnL, average win, average loss, average position duration, and position size.
The second is signal data: how many signals the bot received, how many became positions, and, for the ones that didn’t, the reasons they were turned away. That last column is the same information the Error log carries, and it’s a quick way to see whether your filters are letting through roughly what you expected.
The charts
 🔍 Click the image to see a larger version
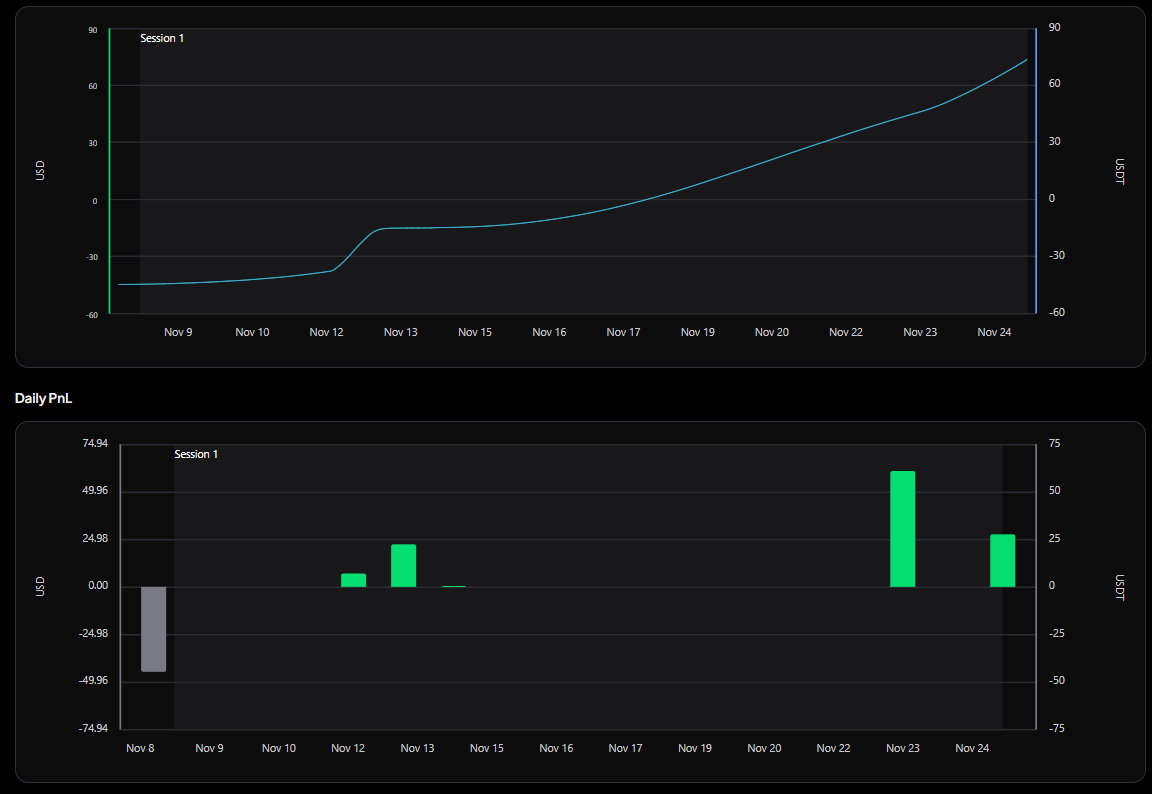
Three charts plot the record over time: cumulative PnL, daily PnL, and closed positions. They’re the fastest way to see the shape of a bot’s performance rather than a single total.
🔍 Click the image to see a larger version
Three charts plot the record over time: cumulative PnL, daily PnL, and closed positions. They’re the fastest way to see the shape of a bot’s performance rather than a single total.
Why you sometimes see few trades
How often a bot trades depends on the market, not on a fixed rate. In a quiet, low-volatility stretch, expect fewer signals and fewer trades. That’s the market being quiet, not a reporting fault.
If the bot has placed no trades for a long stretch and that feels wrong for your settings, that’s a different question: work through Signal Bot Not Trading? A Troubleshooting Checklist rather than treating it as a reporting issue.
Why an email amount can differ from the position size
A bot notification email shows the amount spent on an order. The position shows Size, which is what you actually ended up holding after the exchange’s fee came out. On an exchange that charges its fee in the coin you bought, Size is always a little smaller than the email’s amount. Both are correct: one is what you paid, the other is what you received.
Why a paper bot’s report won’t match a live one
The same settings can produce different results on a paper account and a live one. Paper trading simulates fills without every real-world constraint, while a live exchange can reject an order for insufficient balance, a minimum order size, or another filter. So don’t expect the two reports to line up even with identical settings; the difference is real exchange behaviour, not an Altrady bug.
Still stuck?
If a number still doesn’t make sense after this, reach out through support chat with the bot’s name, the market, whether it’s live or paper, and a screenshot of the figure you’re questioning. If instead you’d like reports or emails laid out differently, that’s a feature request: post it at roadmap.altrady.com.